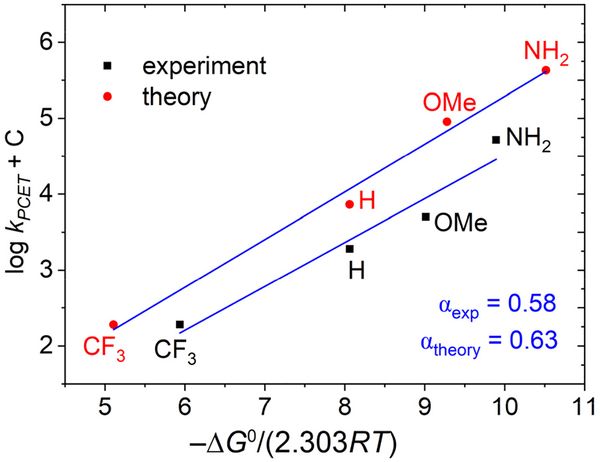
Figure 3.
Computed and experimental correlation between the logarithm of the PCET rate constant and the scaled free energy for four different para-substituents with the oxidant FeCp2+ for λ = 30 kcal/mol. Note that the calculations used the experimentally determined driving force for the H substituent as a reference and the experimentally determined rate constant for the CF3 substituent as a reference to clearly illustrate the slopes.

