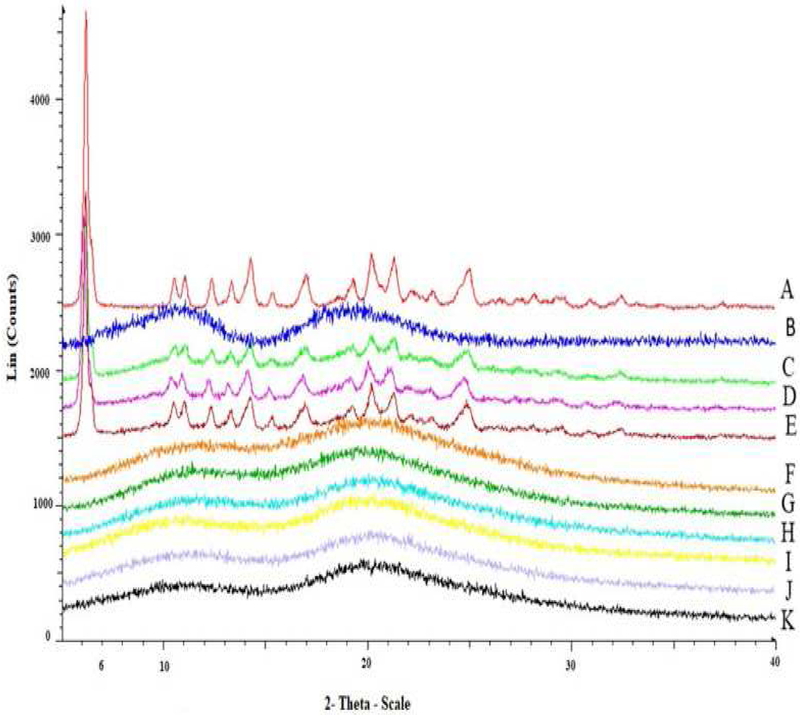
Figure 3.

(A): PXRD diffractograms of pure crystalline EFA, (B): PXRD diffractograms of pure HPMC-AS LG; (C, D, and E): PXRD diffractograms of %30, %40, and %50 EFA/ HPMC-AS LG PM; (F, G, and H): PXRD diffractograms of %30, %40, and %50 EFA/ HPMC-AS LG without P-CO2; (I, J, and K): PXRD diffractograms of %30, %40, and %50 EFA/ HPMC-AS LG with P-CO2
