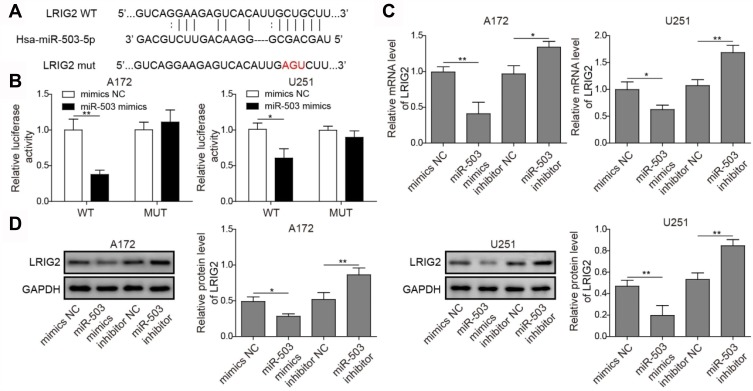
Figure 2.
Detection of interaction between miR-503 and LRIG2. (A) miR-503 and its predicted sites in LRIG2 sequence. (B) The luciferase activity was detected for determining the binding of miR-503 to the predicted sites of LRIG2. (C) qRT-PCR detection of LRIG2 mRNA expression in glioma cells transfected with miR-503 mimics and miR-503 inhibitor. (D) The expression of LRIG2 protein was analyzed by Western blot after indicated treatment. The experiment was repeated for three times. P value was determined by ANOVA following Tukey's post hoc test. Data are the means ± SD for three independent experiments. *P < 0.05;**P < 0.01.

