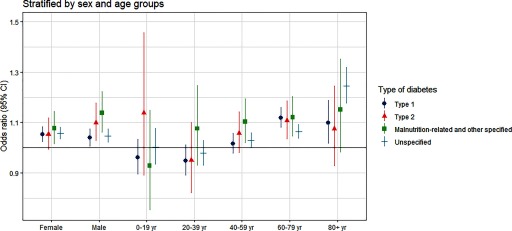
Figure 4.
The association between heat exposure (every 5°C increase in daily mean temperature during the hot season) and diabetes hospitalization [odds ratios with 95% confidence intervals (CIs)], stratified by diabetes subtype and by sex and age group. The odds ratios represent the cumulative association over lag 0–3 d. They came from time-stratified case-crossover analyses modeled by conditional logistic regression with a cross-basis function for daily mean temperature. The model adjusted for public holidays. Corresponding numeric data are provided in Table S4. Hot season was defined as the city-specific adjacent 4 hottest months and varied by city (e.g., December to March for São Paulo, August to November for Manaus).

