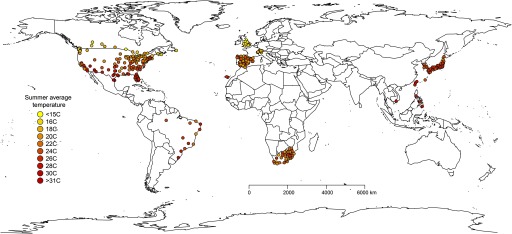
Figure 1.
Study area including 341 locations in 12 countries for periods ranging from 4 to 40 y and the location-specific average summer temperature defined as the daily temperature during June to September in the countries in the Northern Hemisphere and during December to March in the countries in the Southern Hemisphere. See Table 1 for corresponding numeric data and Table S1 for additional information about each country.

