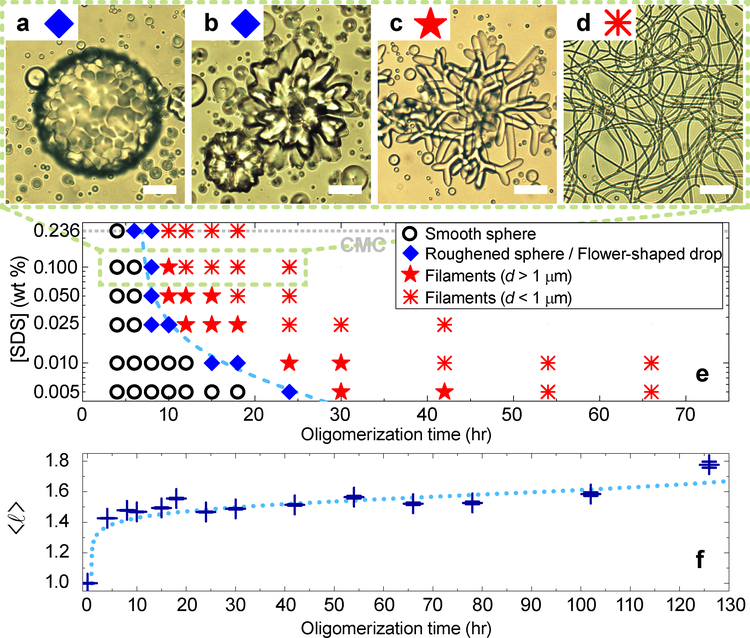
Fig. 2 |. Equilibrium NLCO drop morphologies as function of mean oligomer chain length and surfactant concentration.
a-d, Optical images of common NLCO drop morphologies at room temperature in a 0.1 wt% SDS solution. With increasing 〈ℓ〉, the morphologies shown are (a) roughened spheres (see also Fig. 4a), (b) flower-shaped drops, and (c-d) filamentous structures with decreasing filament diameter. e, A state diagram, constructed from data, exhibits the equilibrium morphology (examples in (a-d)) versus 〈ℓ〉 and surfactant concentration. Increasing either parameter facilitates filament formation better. The dashed curve separates spherical and non-spherical drop regimes. f, Size exclusion chromatography shows that 〈ℓ〉 (in units of monomer length) increases with oligomerization processing time (horizontal axis of plots in (e), (f)). Errors in 〈ℓ〉 mainly arise from the measurement uncertainty of long-chain components. Dotted curve is to guide the eye. Scale bar is 20 μm.

