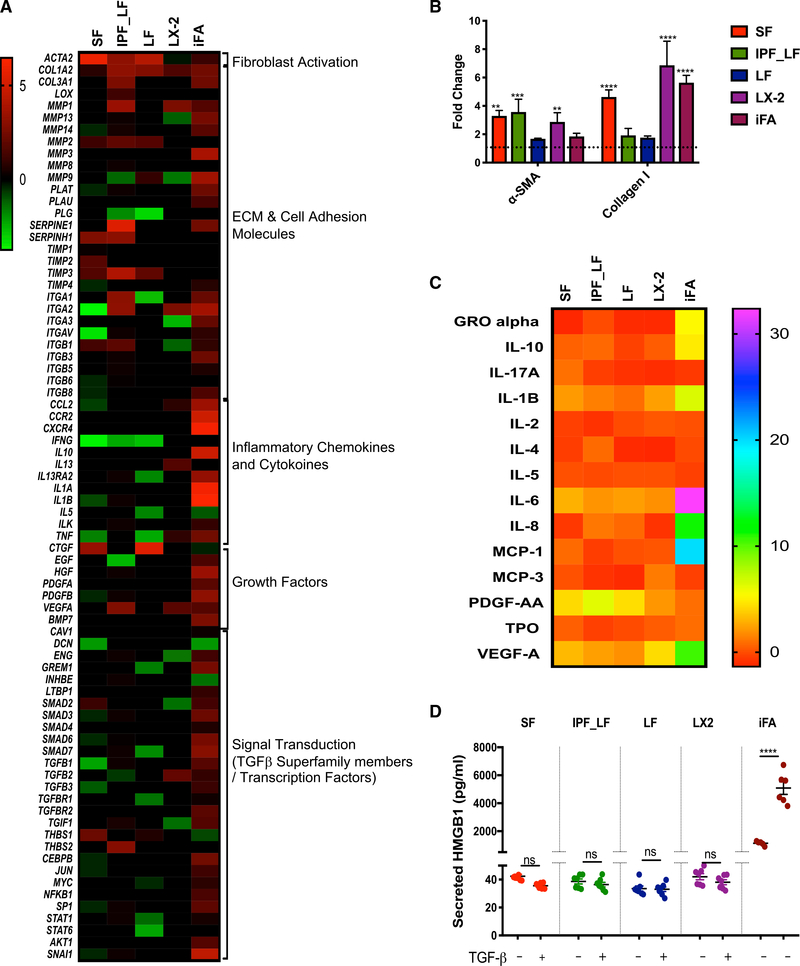
Figure 3. Direct Comparison between the iFA Model and TGF-β-Induced Fibrosis Models Commonly Used in Drug Discovery Programs.
(A) Heatmap summarizing fold change for 84 fibrosis-related genes exhibiting differential expression across the iFA model (day 13 versus day 4) and TGF-β-induced fibrosis models (TGF-β-treated versus untreated); SF, skin fibroblasts; LF, normal lung fibroblasts; IPF-LF, IPF lung fibroblasts; LX-2, hepatic stellate cell line. Heatmaps show log-base-2-transformed data for each experiment mean expression (n = 3) of genes with p value < 0.05 in at least one of the samples per gene.
(B) Densitometric analysis depicting fold change of α-SMA and collagen I in fibrosis models (TGF-β-treated versus untreated) and the iFA model (day 13 versus day 4) analyzed by immunoblotting normalized to total protein (for α-SMA) or β-actin (for collagen I).
(C) Heatmap summarizing fold change of differential expression of cytokines and growth factors in supernatants of fibrosis models (TGF-β-treated versus untreated) and iFA model (day 13 versus day 4) (n = 3 in duplicate). Heatmaps show log-base-2-transformed data for each experiment mean expression (n = 3 in duplicate) of genes with p value < 0.05 in at least one of the samples per protein.
(D) HMGB1 levels determined from conditioned media in the fibrosis models (with and without TGF-β treatment) and the iFA model at day 13 relative to day 4 (n = 6).
Data represent the mean ± SEM; ****p < 0.0001 ***p < 0.001, and **p < 0.01 using two-way ANOVA and Sidak’s multiple comparisons test.

