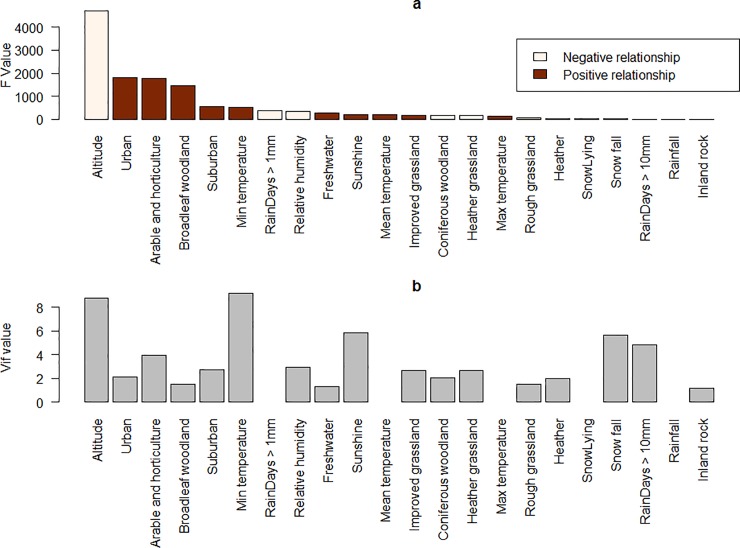
Fig 5. ANOVA analysis F value indicating relative importance of model predictors on consensus model values.
(Fig 5A) Colour indicates direction of relationship between predictor and output. (Fig 5B) VIF values for model predictors, higher values indicate predictor less likely to be needed in the model, a value of 0 indicates that the variable was never chosen in the model.

