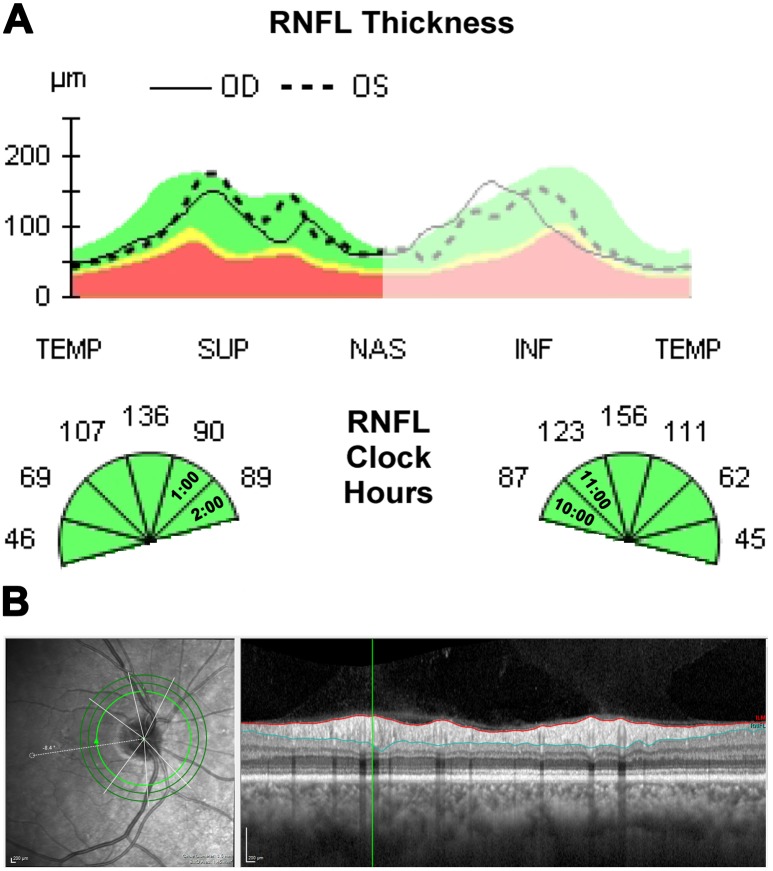
Fig 1. Study methods.
(A) Subset of the Cirrus OCT retinal nerve fibre layer analysis showing the TSNIT profile and sectoral thickness values. For the study, patients were first categorised into control or asymmetry groups according to corresponding superonasal sectors in both eyes. The difference in thickness (90 versus 123 microns in this example shown) places this case into the asymmetry group. (B) Blood vessel location, thickness and corresponding RNFL thickness were then quantified using the software selector bar (vertical green line appearing on the OCT B-scan) along the innermost 3.5mm diameter calculation circle of the Spectralis OCT.

