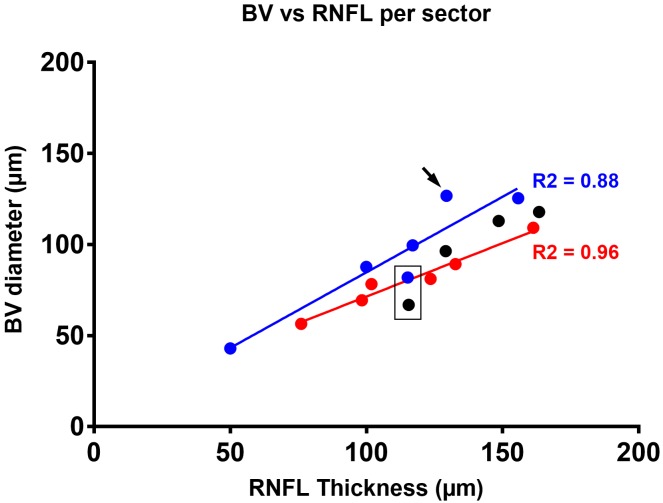
Fig 5. Correlation between mean blood vessel diameter and corresponding RNFL thickness averaged for sector per vessel type.
A strong positive correlation was observed between arteries (red, p = 0.0005) and veins (blue, p = 0.0057) respectively and corresponding RNFL thickness. The data demonstrate a direct relationship for increasing thickness, which was lowest in the temporal sector (0–30°) and highest in the superotemporal sector (60–90°). Linear regression for veins in the left eye of the asymmetry group (depicted as black circles for sectors located between 31° and 150°) differed significantly from all other analyses performed for veins (Table 3). While all veins located in the lower superonasal area (31–60°) were associated with larger than expected RNFL thickness (black box), a notable deviation in the opposite direction was noted for the higher superonasal sector (90–120°) for all veins (black arrow) when compared to those of the left eye or the asymmetry group or the association identified for arteries.

