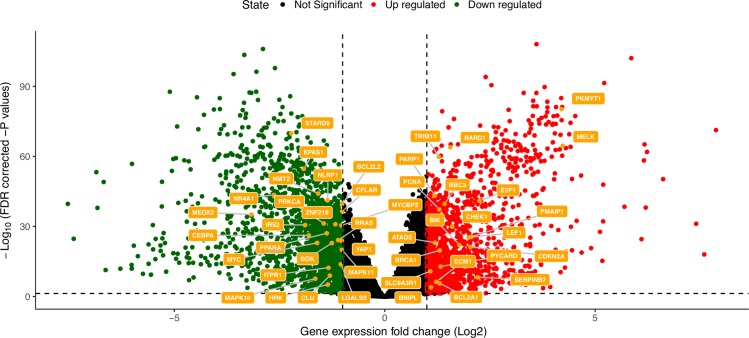
Fig 3. Differentially expressed (DE) BCL-2 and BH3-containing genes.
We show as a volcano plot the BCL-2 and BH3-only genes, which are among the list of DE genes between tumor and normal tissues. The horizontal dashed line indicates the FDR cutoff (0.05). The vertical dashed lines represent the cutoffs in terms of logFc for up- and down-regulated genes. The other comparisons at the subtype level are reported in the GitHub repository associated to the publication and summarized in S4 Table.

