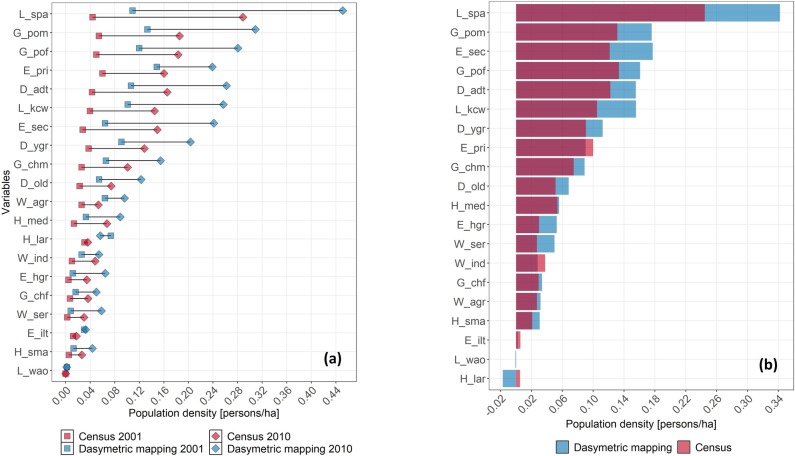
Fig 7.
(a) Population density differences between dasymetric mapping and census data for 2001 and 2010; and (b) subtraction to derive population density change between 2001 and 2010. In both cases, variables were ordered according to magnitude and transparent color was used to see overlapping areas (red is over blue).

