Figure 3.

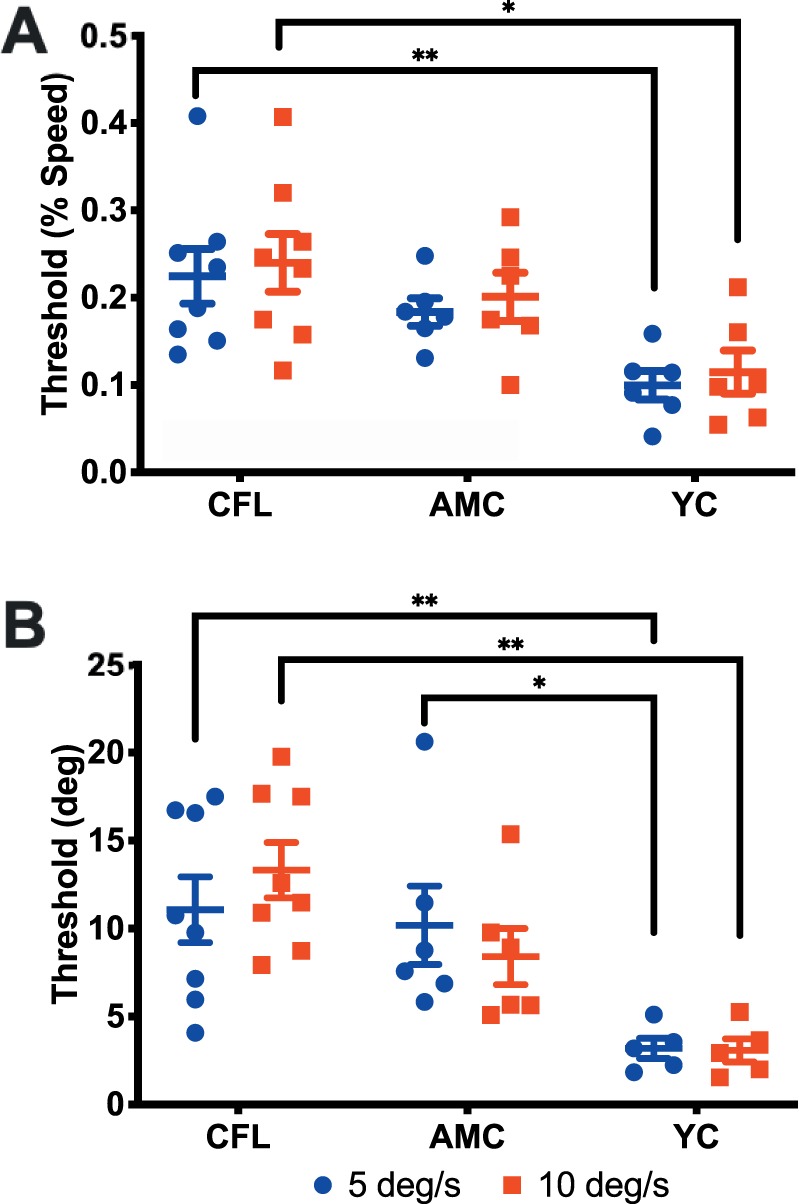
Speed (A) and direction (B) discrimination thresholds for the three tested groups. Blue and red points represent individual data for the 5°/s and 10°/s conditions, respectively. Error bars: standard error of the mean.

Speed (A) and direction (B) discrimination thresholds for the three tested groups. Blue and red points represent individual data for the 5°/s and 10°/s conditions, respectively. Error bars: standard error of the mean.