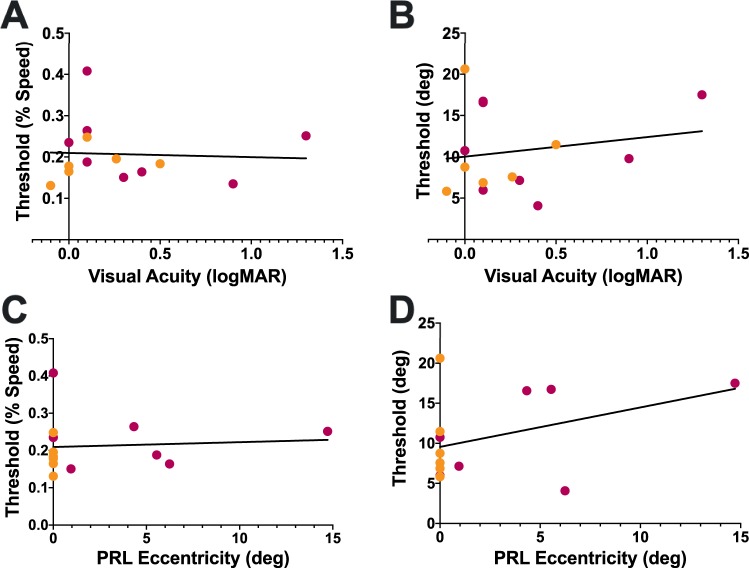
Figure 5.
Speed and direction discrimination thresholds are plotted as a function of binocular visual acuity (A–B) and PRL eccentricity of the better eye (C–D). CFL and age-matched control participants are shown in maroon and orange, respectively. Black lines indicate linear regressions done for the combined data set, none of which is significantly different from zero.

