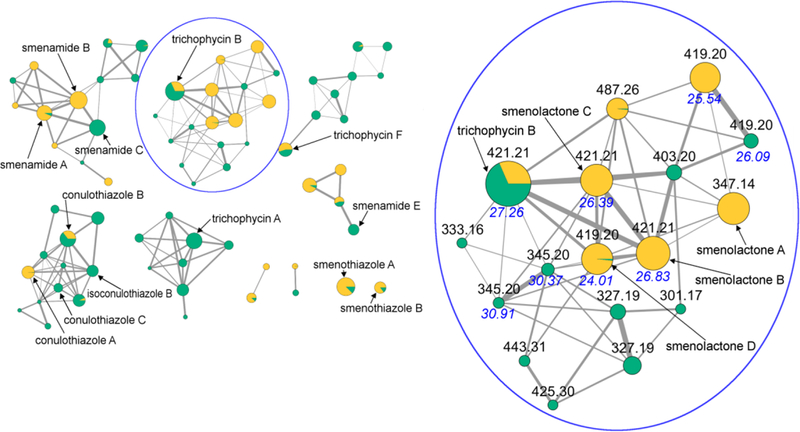
Fig. 1.

The molecular network obtained combining the LC-MS/MS analyses of extracts from S. aurea and Trichodesmium sp‥ Nodes are represented as a pie chart showing the source of the compound (yellow: S. aurea, green: Trichodesmium sp.). Node size is relative to ion count, edge thickness is relative to cosine score. The networking cluster containing trichophycin B (17) and the new smenolactones A-D (1-4) is expanded, and nodes are labeled with parent m/z values and HPLC retention times. Retention times of isomeric compounds are shown in blue.
