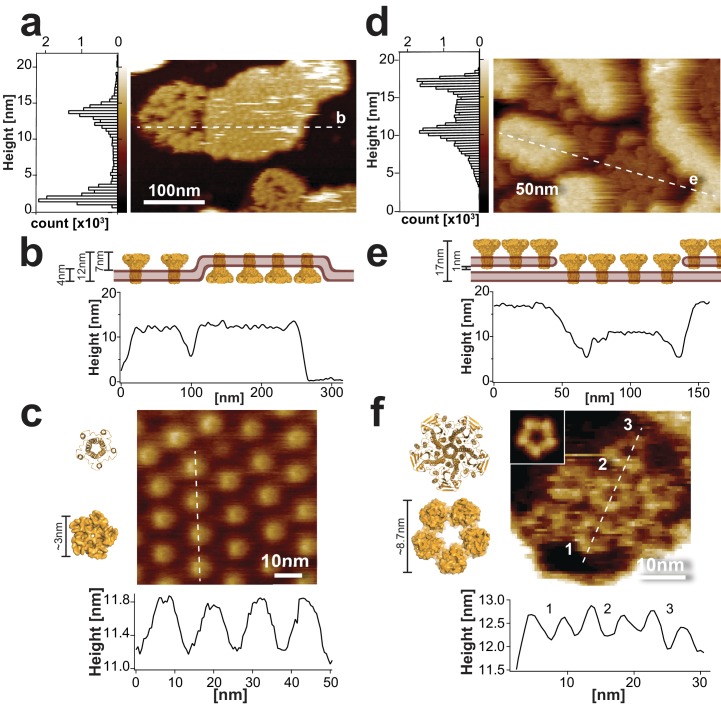
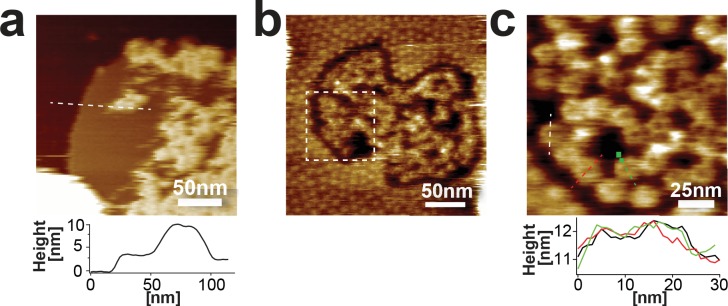
Figure 1. Sample morphology of CorA reconstitutions for HS-AFM.
(a) HS-AFM overview topograph of densely packed CorA in a POPC/POPG (3:1) lipid bilayer exposing the periplasmic side and a loosely packed protein area with diffusing molecules exposing the intracellular face (full color scale: 20 nm). Left: Height histogram of the HS-AFM image with two peaks representative of the mica and the CorA surface (∆Height (peak-peak): 12 nm (20,500 height values)). The dashed line indicates the position of the cross-section analysis shown in (b). (b) Profile of the membrane shown in a), including a cartoon (top) of the membrane in side view. The height profile (~12 nm) corresponds well to the all-image height analysis (a, left) and the CorA structure (Matthies et al., 2016). (c) High-resolution image (top) and cross-section analysis along dashed line (bottom) of the periplasmic face. The height and dimension of the periplasmic face is in good agreement with the structure (left), and the periodicity (~14 nm, n = 40) corresponds well with the diameter of the intracellular face spacing the molecules on the other side of the membrane (full color scale: 2 nm). (d) HS-AFM image of densely packed CorA embedded in a DOPC/DOPE/DOPS (4:5:1) membrane. This reconstitution resulted in two stacked membrane layers, both exposing the CorA intracellular face. The dashed line indicates the position of the cross-section analysis shown in (e). Left: Height histogram of the HS-AFM image with two peaks at ~12 nm and ~17 nm (32,500 height values), corresponding to the proteins in two stacked membranes (full color scale: 20 nm). (e) Section profile of the membrane shown in d), including a cartoon (top) of the membrane in side view. (f) High-resolution view and cross-section analysis along dashed line (bottom) of the CorA intracellular face revealing the individual subunits of the pentamers (full color scale: 3 nm). Inset: 5-fold symmetrized average of CorA. The dimensions of CorA observed with HS-AFM are in good agreement with the structure (left: PDB 3JCF). The structures in (c) and (f) are shown in ribbon (top) and surface (bottom) representations, respectively.


