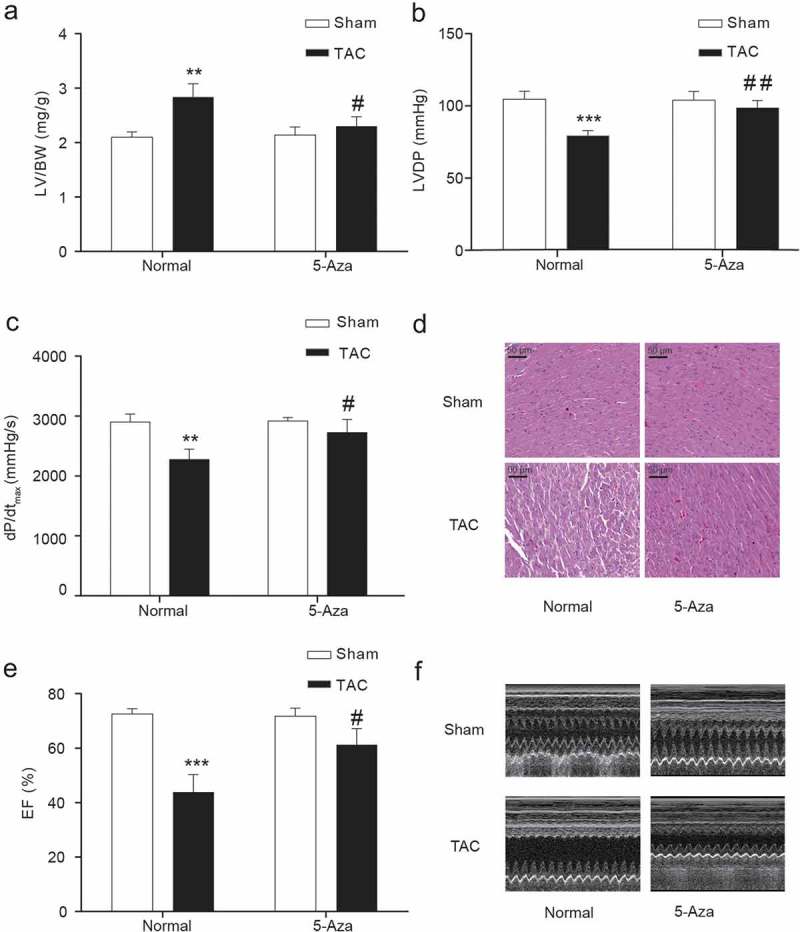
Figure 2.

Cardiac functions of rats in each group.
(a) LV/BW (b) LVDP (c) The maximal rate of the increase in left ventricular pressure (dp/dt max) (d) HE staining of cardiac tissue. (E-F) Ejection fraction (%) measured by echocardiography. LV, left ventricle; BW, body weight, EF, ejection fraction. Data are presented as the mean ± SD of five animals; **P < 0.01, ***P < 0.001 vs. Sham-Normal group, # P < 0.05, ## P < 0.01 vs. TAC-Normal group.
