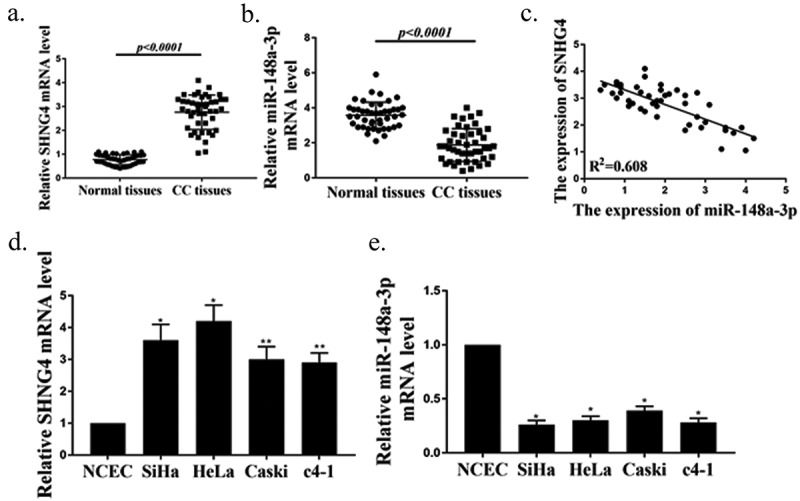
Figure 1.

Measurement of SNHG4 and miR-148a-3p expressions in CC tissues and cell lines. (a, b) Measurement of expressions of SNHG4 (p < 0.0001) (a) and miR-148a-3p(p < 0.0001) (B) in CC tissues (n = 45) and normal tissues (n = 45). (c) Pearson correlation analysis of SNHG4 and miR-148a-3p expressions in CC tissues (n = 45). (d, e) Measurement of expressions of SNHG4 (d) and miR-148a-3p (e) in CC cells. ** P < 0.001, * P < 0.0001.
