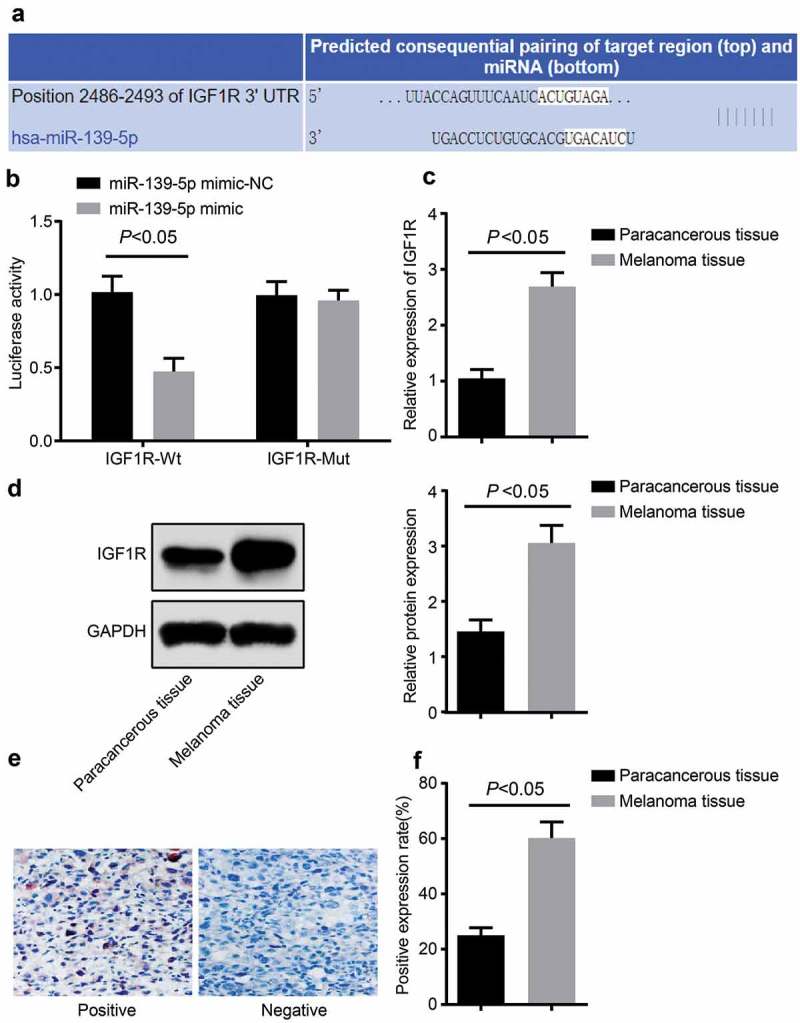
Figure 3.

MiR-139-5p targeted and down-regulated IGF1R. (a), the bioinformatics site was used to forecast the binding sites of miR-139-5p and IGF1R; (b), the dual-luciferase reporter gene assay was used to detect the targeted relation between IGF1R and miR-139-5p; C, RT-qPCR was used to measure the mRNA expression level of IGF1R in tissues; (d), western blot analysis was used to detect the expression level of IGF1R protein in tissue; (e), immunohistochemical staining of IGF1R protein in tissues; (f), the rate of positive expression of IGF1R protein in tissues. Data were all measurement data and expressed as mean ± standard deviation; the independent t-test was adopted for statistical analysis; * P< 0.05vs the miR-139-5p mimic-NC group; # P< 0.05vsadjacent normal skin tissues.
