Figure 2.

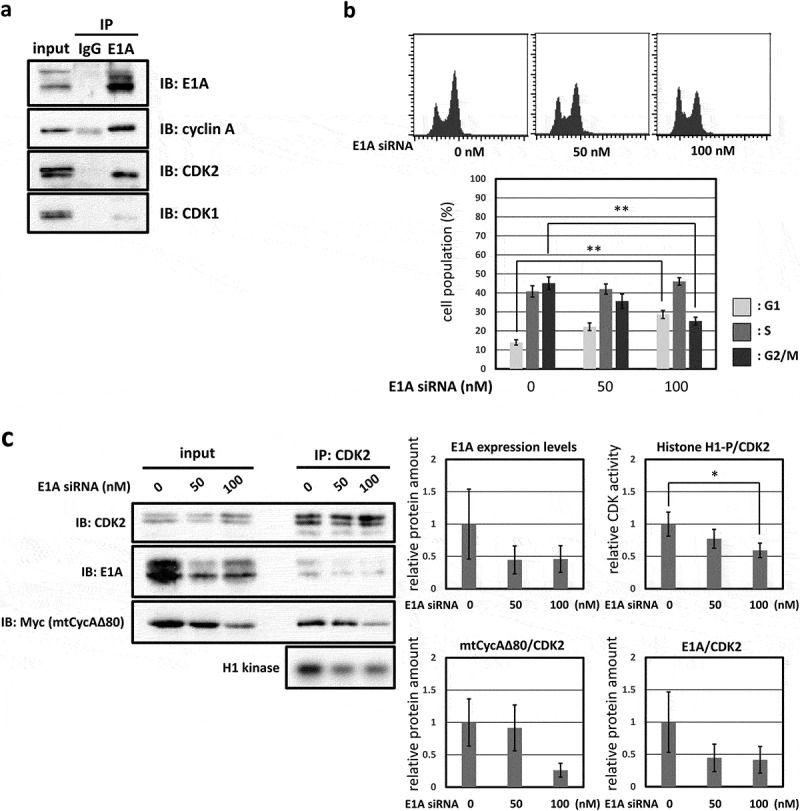
G2/M-phase arrest is enhanced by co-expressing E1A. (a) Extracts from HEK293 cells were immunoprecipitated with control IgG and anti-E1A antibody, and immunoblotted for cyclin A (CycA), CDK1 and CDK2. (b) 10 µg of the mtCycAΔ80 vector was co-transfected with indicated concentrations of E1A-specific siRNA and 1 µg of the GFP vector in HEK293 cells, and cell cycle profiles of the GFP-positive cells were analyzed by flow cytometry (top). Cell cycle distributions are shown in the bottom panel. **p < 0.01. (c) Extracts from HEK293 cells co-transfected with the mtCycAΔ80 vector and E1A-specific siRNA were immunoprecipitated with anti-CDK2, immunoblotted for E1A and mtCycAΔ80, and assayed for histone H1 kinase activity (left panel). Relative E1A protein amount (0 nM siRNA = 1) in the cell extracts (input) is shown in the top middle panel. H1 kinase activity relative to the amount of CDK2 proteins (0 nM E1A siRNA = 1) is shown in the top right panel. Relative amounts of CDK2-associated mtCycAΔ80 and E1A (0 nM E1A siRNA = 1) are shown in the middle and right bottom panels, respectively. *p < 0.05. (d) Indicated amounts of the mtCycAΔ80 vector was co-transfected with 5 µg of E1A expression vector (pE1A) and 1 µg of the GFP vector in MDAH041 cells, and cell cycle profiles of the GFP-positive cells were analyzed by flow cytometry (top). Cell cycle distributions are shown in the bottom panel. *p < 0.05, **p < 0.01. (e) Extracts from MDAH041 cells co-transfected with 10 µg of the mtCycA WT or mtCycAΔ80 vector, with or without 5 µg of pE1A, were immunoprecipitated with anti-myc-tag and immunoblotted for CDK2 and E1A (left panel). Relative amounts of mtCycA-associated CDK2 (mtCycA WT only = 1) are shown in the right panel. **p < 0.01. (f) Extracts from MDAH041 cells co-transfected with 10 µg of the mtCycAΔ80 vector, with or without 5 µg of pE1A, were immunoprecipitated with anti-CDK2, immunoblotted for E1A, cyclin E, and mtCycAΔ80, and assayed for histone H1 kinase activity (left panel). H1 kinase activity relative to the amount of CDK2 proteins is shown in the middle top panel (E1A- = 1). Relative amounts of CDK2-associated mtCycAΔ80 and cyclin E (E1A- = 1) are shown in the bottom panels (middle and right, respectively).
