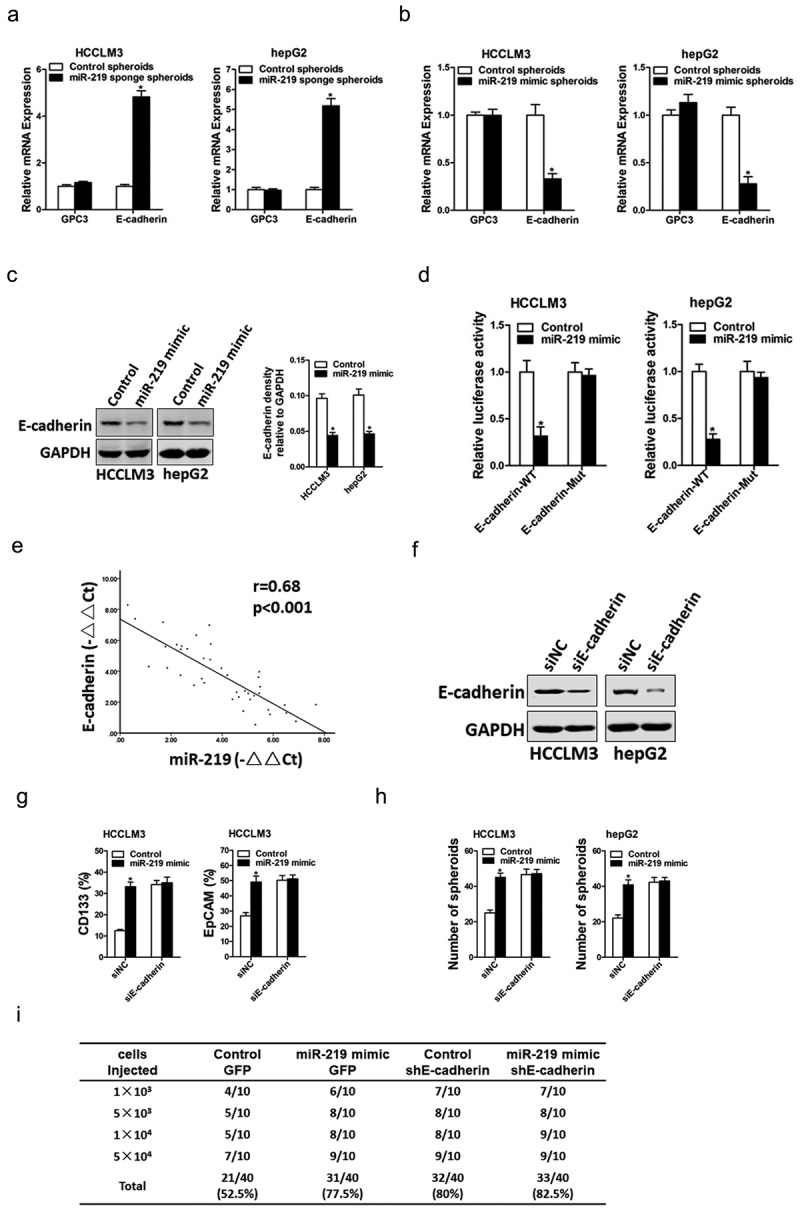
Figure 4.

E-cadherinis required for miR-219 in liver CSCs.
a. The mRNA expression of GPC3 and E-cadherin was checked in miR-219 sponge and control liver CSCs by real-time PCR (n = 3). b. The mRNA expression of GPC3 and E-cadherin was checked in miR-219 mimic and control liver CSCs by real-time PCR (n = 3). c. The protein level of E-cadherin was checked in miR-219 mimic and control liver CSCs by western blot assay. d. Luciferase reporter assays performed in miR-219 mimic and control hepatoma cells transfected with wild-type or mutant E-cadherin 3ʹ-UTR plasmids (n = 3). e. Significant correlation was observed between miR-219 andE-cadherin expression in HCC tissues (n = 40). f. Hepatoma cells were transfected with E-cadherin siRNA or negative control, and then subjected to western blot assay. g. HCCLM3miR-219 mimic and its control cells were transfected with E-cadherin siRNA or negative control, and the CD133+ orEpCAM+ HCC cells were checked by flow-cytometric assay (n = 3). h. miR-219 mimic and control hepatoma cells were transfected with E-cadherin siRNA or negative control, and then subjected to spheroid formation (n = 3). i. HCCLM3 miR-219 mimic and its control cells were transfected with E-cadherin siRNA or negative control, and then subjected to in vivo limiting dilution assay. Tumors were observed over 2 months; n = 10 for each group. (Data are represented as mean±s.d.; *P < 0.05; two-tailed Student’s t-test.)
