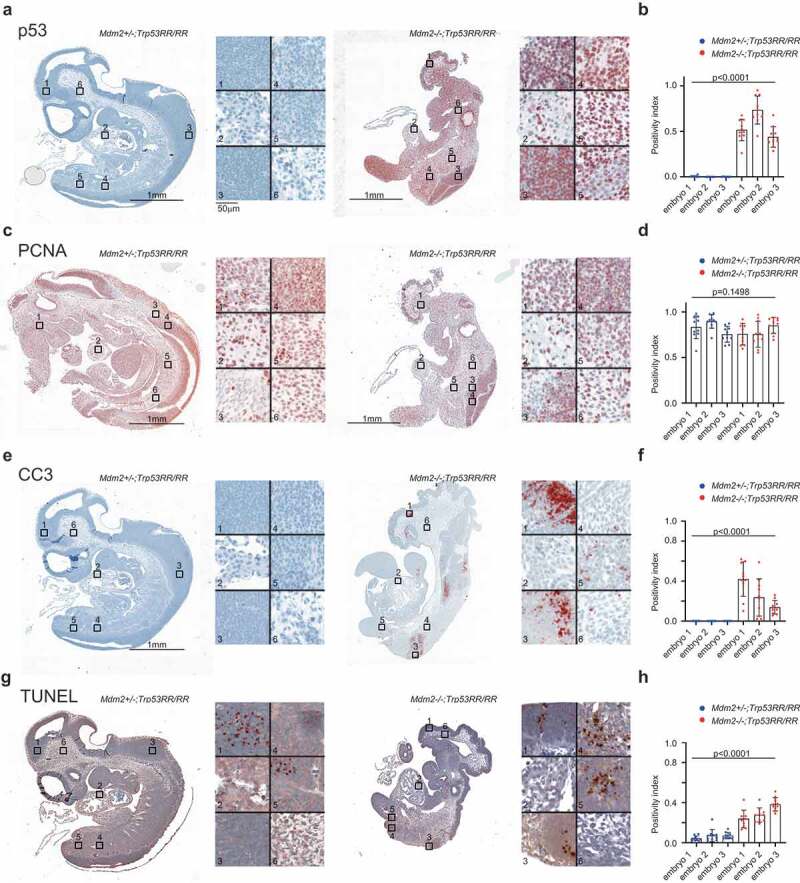
Figure 3.

Mdm2Δ7−9/Δ7−9; Trp53RR/RR embryos die with signs of apoptosis. (a,b) Representative immunohistochemical (IHC) staining of Mdm2+/Δ7−9 and Mdm2Δ7−9/Δ7−9;Trp53RR/RR E10.5 embryos using anti-p53 antibodies. Right panel: different tissues shown at high magnification (1,3 – neuroepithelial, 2 – heart, 4,5 – somites, 6 – mesenchyme). Strong accumulation of p53 protein is evident in all tissues except the heart in Mdm2Δ7−9/Δ7−9;Trp53RR/RR samples. (b) – quantification of IHC staining in 3 embryos for each genotype, 10 random fields of view covering in total >50% of the section area, ANOVA test. (c,d) IHC staining of proliferating cells nuclear antigen (PCNA) in a serial section from the same samples as in (a). Right panel: different tissues shown at high magnification (1 – mesenchyme, 2 – heart, 3,4 – neuroepithelial, 5,6 – somites). (d)- quantification of PCNA staining, done as in (b), shows a slight reduction in PCNA levels in Mdm2Δ7−9/Δ7−9;Trp53RR/RR embryos, ANOVA test. (e,f) IHC staining of apoptosis marker cleaved caspase 3 (CC3) in a serial section from the same samples as in (a). Right panel: different tissues shown at high magnification (1,3 – neuroepithelial, 2 – heart, 4,5 – somites/limb bud, 6 – mesenchyme). Note apoptosis in neural tissues and limb bud of Mdm2Δ7−9/Δ7−9;Trp53RR/RR embryo. (f) – quantification of IHC staining in 3 embryos for each genotype, done as in (b), ANOVA test. (g,h) Terminal deoxynucleotidyl transferase (TdT) dUTP Nick-End Labeling (TUNEL) assay in a serial section from the same samples as in (a). Right panel shows the same sites as in (e). Note only a small foci of apoptosis in neural tissue of the normal Mdm2+/Δ7−9;Trp53RR/RR embryo, whereas massive apoptosis is observed in multiple tissues of the abnormal double homozygous Mdm2Δ7−9/Δ7−9;Trp53RR/RR embryo. (h) – quantification of IHC staining, done as in (b), ANOVA test.
