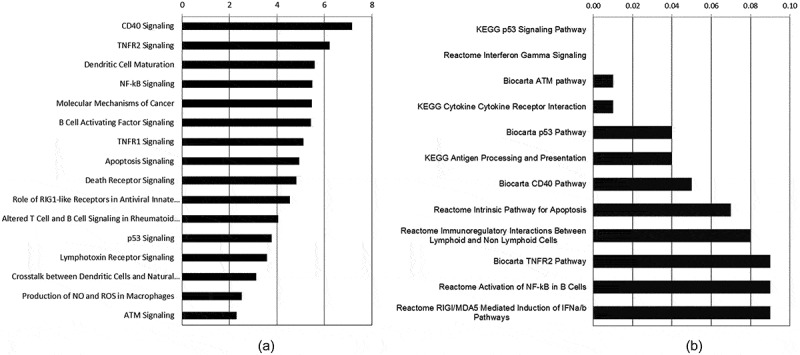
Figure 1.

Selected significantly affected signaling pathways over-represented in WT cells exposed to 1 Gy IR. A) A selection of the top Ingenuity Pathways Analysis Canonical Pathways (-log10 (p-value) shown on X axis) that passed a cutoff of p ≤ 0.005 (-log10 ≥ 2.3). B) A selection of the top enhanced GSEA Pathway Gene Sets (FDR q-value ≤ 0.10).
