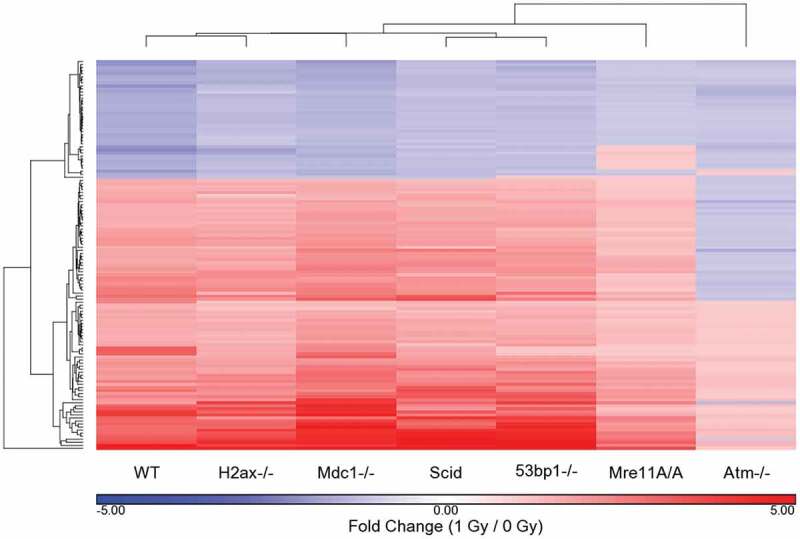
Figure 3.

Differentially regulated probe sets in WT cells exposed to 1 Gy IR: comparison of genotype specific responses to the WT response. The fold change values, based on average genotype intensity levels from 1 Gy/0 Gy exposure, were generated and compared to those that were significant in WT cells based on a p-value cutoff of p ≤ 0.05 and a fold change ǀFCǀ ≥ 1.5. The fold change values were hierarchically clustered to determine the similarities and differences between the genotypes based on the 128 significant probe sets of the WT response to IR. Fold change values in this cluster for non-WT genotypes are not necessarily significant for that genotype based on p-value or fold change cutoffs.
