
Figure 5.
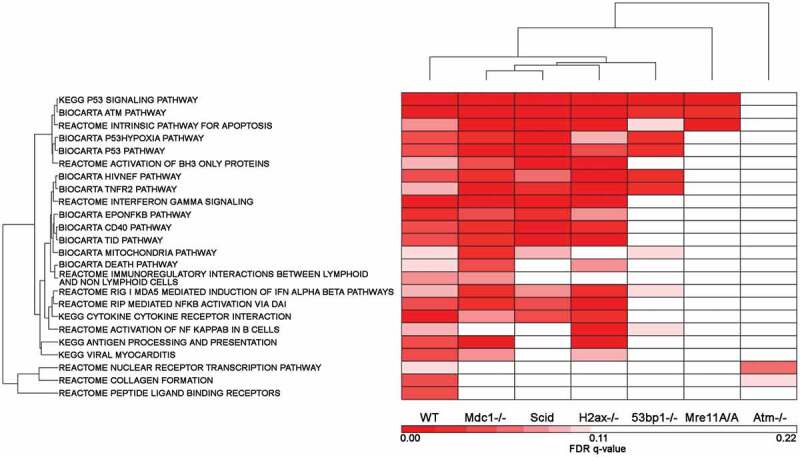
Gene Set Enrichment Analysis Pathways that met a FDR q-value cutoff of q ≤ 0.1 in WT cells: comparison of WT response to the remaining 6 genotypes. The GSEA Pathway FDR q-values generated for each genotype were compared for the 24 up-regulated pathways that were significant in WT cells based on a q-value of ≤ 0.1. The q-values of each genotype, each based on their own probe set list, were clustered to determine the similarities and differences between the 7 genotypes based on the WT response to IR.