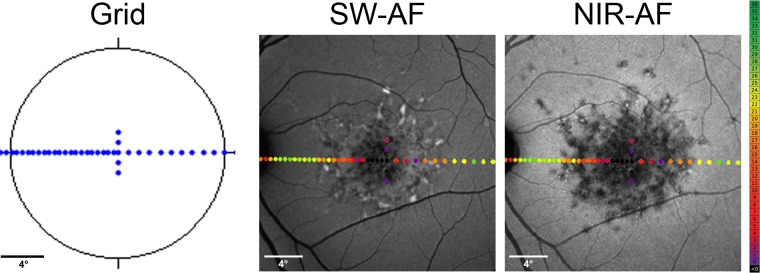
Figure 1.
Microperimetry and image analysis. Using fundus-controlled perimetry, retinal sensitivity was examined at 50 loci along a horizontal line through the foveal center covering 30° of the central visual field with dense testing points between fovea and optic nerve head (left). For structure–function correlation, perimetric results were aligned and overlaid with SW-AF (middle) and NIR-AF images (right).

