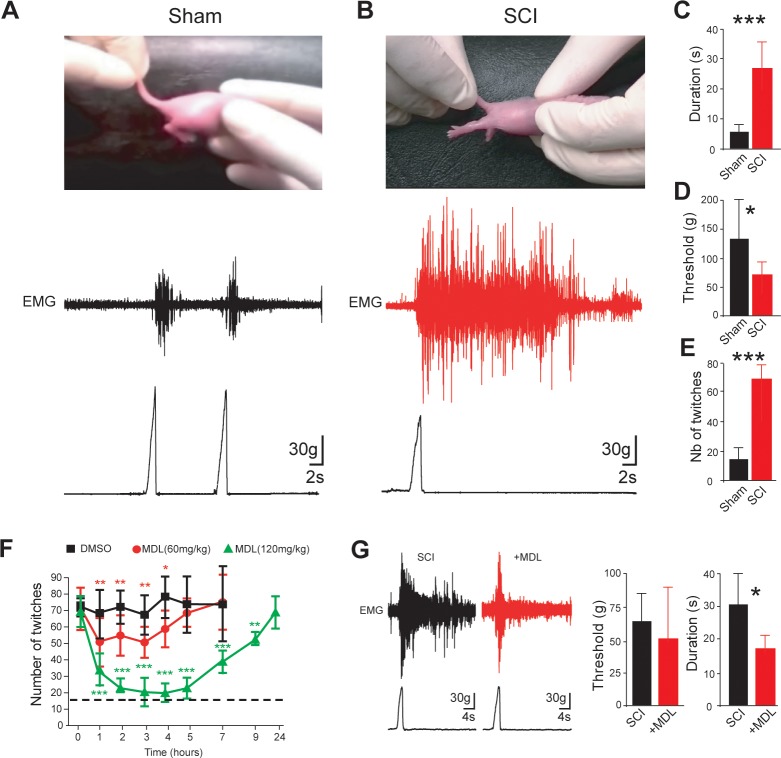
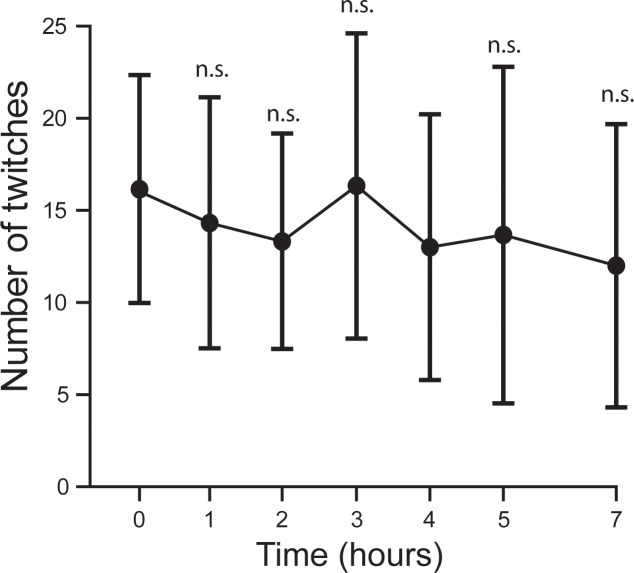
Figure 1. Calpain inhibition alleviates early behavioral signs of spasticity in neonatal rats with SCI.
(A,B) Pictures of typical hindlimb motor response to tail pinching in sham-operated (A), n = 6 rats) and SCI rats (B), 5 d post-SCI, n = 8 rats). Lower and upper traces represent the pinch force and the evoked electromyographic (EMG) response of the triceps surae muscle, respectively. (C,D) Group means quantification of EMG responses. *p<0.05, ***p<0.001 comparing sham versus SCI groups; Mann-Whitney test. (E) Groups means quantification of twitches over a time period of 10 min obtained from sham-operated and SCI rats (5 d post-SCI) at rest on heating pad (~34.5°C). ***p<0.001 comparing sham versus SCI groups (n = 22 rats in both groups); Mann-Whitney test. (F) Time-course changes of twitches after acute i.p. administration (t = 0) of vehicle (black, n = 5 rats) or MDL28170 at 60 mg/kg (red, n = 5 rats) or MDL28170 at 120 mg/kg (green, n = 5 rats) in SCI neonatal rats (5 d post-SCI). *p<0.05, **p<0.01, ***p<0.001, repeated measures one-way ANOVA, Dunnett’s post-test. (G) Representative EMG responses of the triceps surae muscle to tail pinching in SCI neonatal rats (5 d post-SCI) 60 min after an acute i.p. administration of vehicle (black, n = 9 rats) or MDL28170 (red, 120 mg/kg, n = 6 rats). Lower traces represent the pinch force. Group means quantification of EMG responses on the right-hand side. *p<0.05; comparing vehicle-treated versus MDL28170-treated rats; Mann-Whitney test. Underlying numerical values can be found in the Figure 1—source data 1.


