
Figure 2. The expression of Calpain-I increased after SCI.
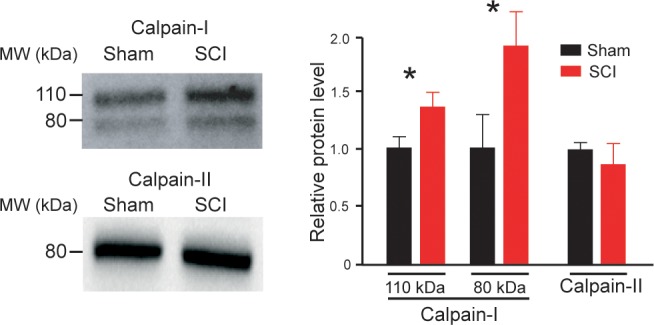
On the left, calpain-I and calpain-II immunoblots of lumbar segments in sham-operated (n = 4 rats) and SCI neonatal rats (5 d post-SCI, n = 4 rats). One rat per lane. On the right, group means quantification of bands of both calpain-I and calpain-II in SCI rats normalized to sham-operated controls. *p<0.05 comparing sham versus SCI groups; Mann-Whitney test. Data are means ± SD. Underlying numerical values can be found in the Figure 1—source data 1.
Figure 2—source data 1. Values displayed in bar plots in Figure 2.
elife-51404-fig2-data1.xlsx (10.1KB, xlsx)