. 2019 Dec 9;8:e51404. doi: 10.7554/eLife.51404

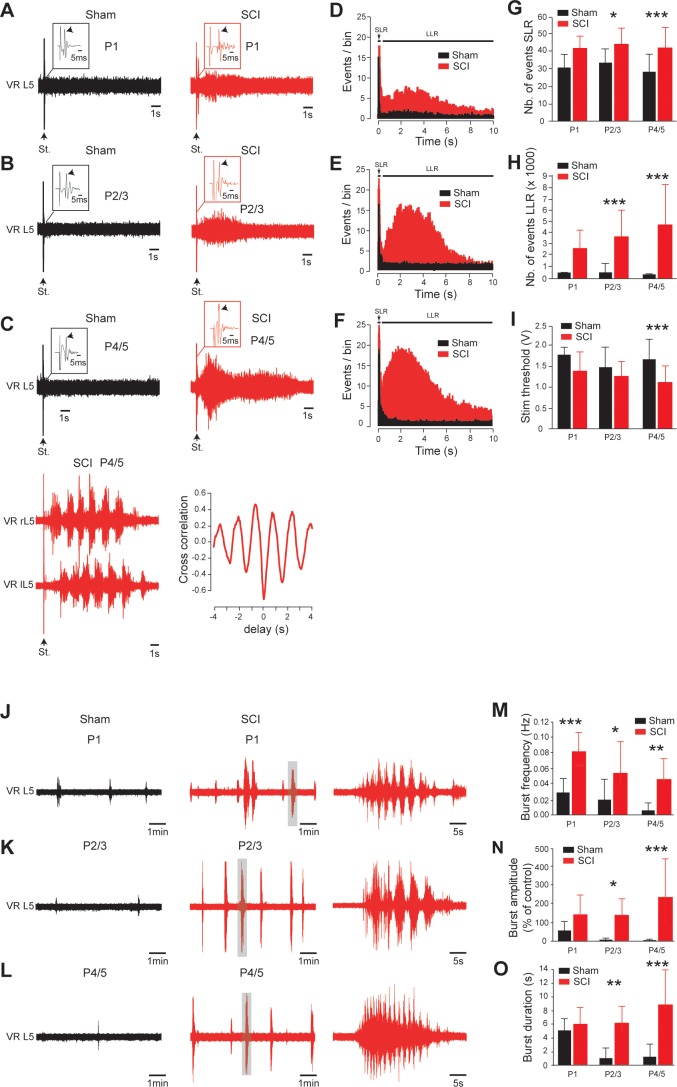
Figure 3. Early development of hyperexcitability on caudal spinal cord after SCI.

(A–C, J–L) Representative L5 ventral root activities (VR L5) evoked by a supramaximal stimulation (St.) of the ipsilateral dorsal root (A–C) or occurring spontaneously (J–L) in spinal cords isolated 1 d (A, J), 2–3 d (B,K) or 4–5 d (C,L) after sham surgery (black) or SCI (red) [for A–C: 1 d, n = 24 sham and n = 6 SCI; 2–3 d, n = 29 sham and n = 10 SCI; 4–5 d, n = 52 in both groups; for J–L: 1 d, n = 12 sham and n = 7 SCI; 2–3 d, n = 11 sham and n = 12 SCI; 4–5 d, n = 10 sham and n = 17 SCI]. Insets in (A–C) are enlargements of the monosynaptic reflex while single arrows indicate the monosynaptic reflex and the stimulus artifact (St.). Bottom traces in (C) illustrate a dorsal root-evoked alternating locomotor-like activity recorded from opposite L5 ventral roots, with the corresponding cross-correlation histograms for left/right relationship. Parts of the recordings in J–L indicated by shaded areas are shown at a faster time scale on the right-hand side. (D–F) Average peristimulus time histogram (PSTH, bin width: 20 ms) of dorsal root evoked L5 ventral root responses collected from sham-operated (black) or SCI rats (red) 1 d (D), 2–3 d (E) or 4–5 d (F) post-SCI. (G–I,M–O) Group means quantification of: events per rat detected over time windows of 10–40 ms and 500–15,000 ms post-stimulus for SLR and LLR, respectively (G,H), threshold for evoking ventral root responses (i) and of spontaneous activites (M–O) at different time points post-SCI. *p<0.05, **p<0.01, ***p<0.001 comparing sham versus SCI groups; two-way ANOVA, Bonferroni’s post-test. Data are means ± SD. Underlying numerical values can be found in the Figure 3—source data 1.

Figure 3—source data 1. Values displayed in bar plots shown in Figure 3G-I, M-O.

Figure 3.

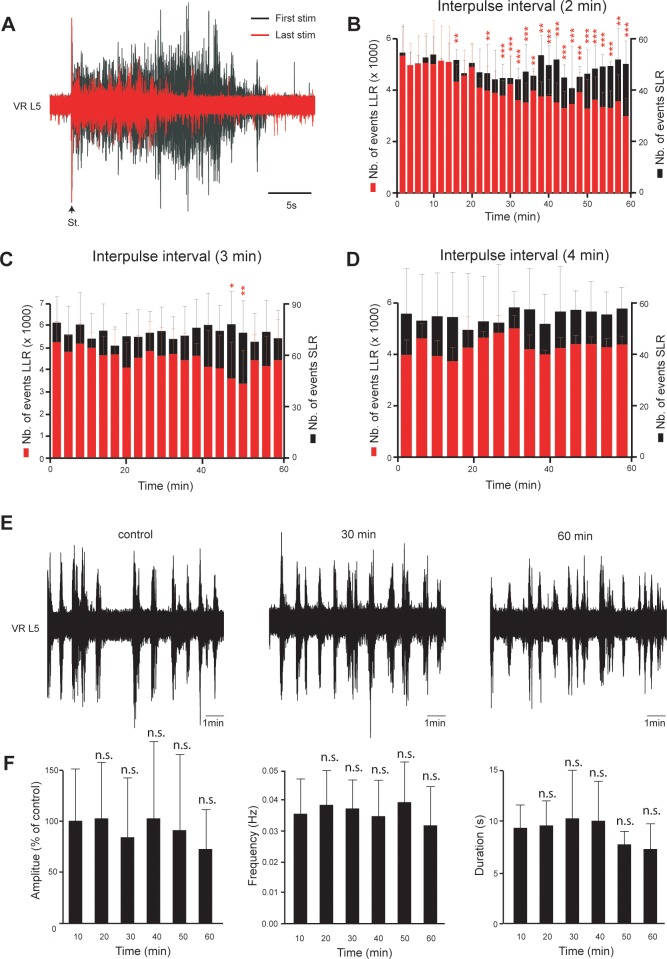
Figure 3—figure supplement 1. Stability of both hyperreflexia and spontaneous activities in spinal cord isolated from neonatal rats with SCI.

Figure 3—figure supplement 1.

(A) Superimposition of the first (black) and the last (red) dorsal root evoked L5 ventral root responses recorded in spinal cord isolated from SCI rats (4–5 d post-SCI) during a stimulation session of 60 min with an interpulse interval of 2 min. (B–D) Mean time course changes in the peristimulus time histogram (PSTH) of L5 ventral root responses (VR L5) during repetitive supramaximal stimuli of the ipsilateral dorsal root delivered with an interpulse interval of 2 min (B), n = 7 rats), 3 min (C), n = 9 rats) or 4 min (D), n = 6 rats). The transient short latency (SLR, black) and long-lasting reflexes (LLR, red) were computed over time windows of 10–40 ms and 500–15,000 ms post-stimulus, respectively. *p<0.05, **p<0.01, ***p<0.001, repeated measures one-way ANOVA, Dunnett’s post-test. Values measured during the first time window are taken as control values. Data are means ± SD. (E) Spontaneous activities recorded on L5 ventral root (VR L5) as a function of time in spinal cord isolated from SCI rats (4–5 d post-SCI, n = 9 rats). (F) Time course changes in amplitude, frequency and duration of spontaneous activities. n.s. p>0.05, repeated measures one-way ANOVA, Dunnett’s post-test. Values measured during the first time window are taken as control values. Data are means ± SD. Underlying numerical values can be found in the Figure 3—figure supplement 1—source data 1.
Figure 3—figure supplement 1—source data 1. Values displayed in bar plots shown in Figure 3—figure supplement 1B–D, F.