. 2019 Dec 9;8:e51404. doi: 10.7554/eLife.51404

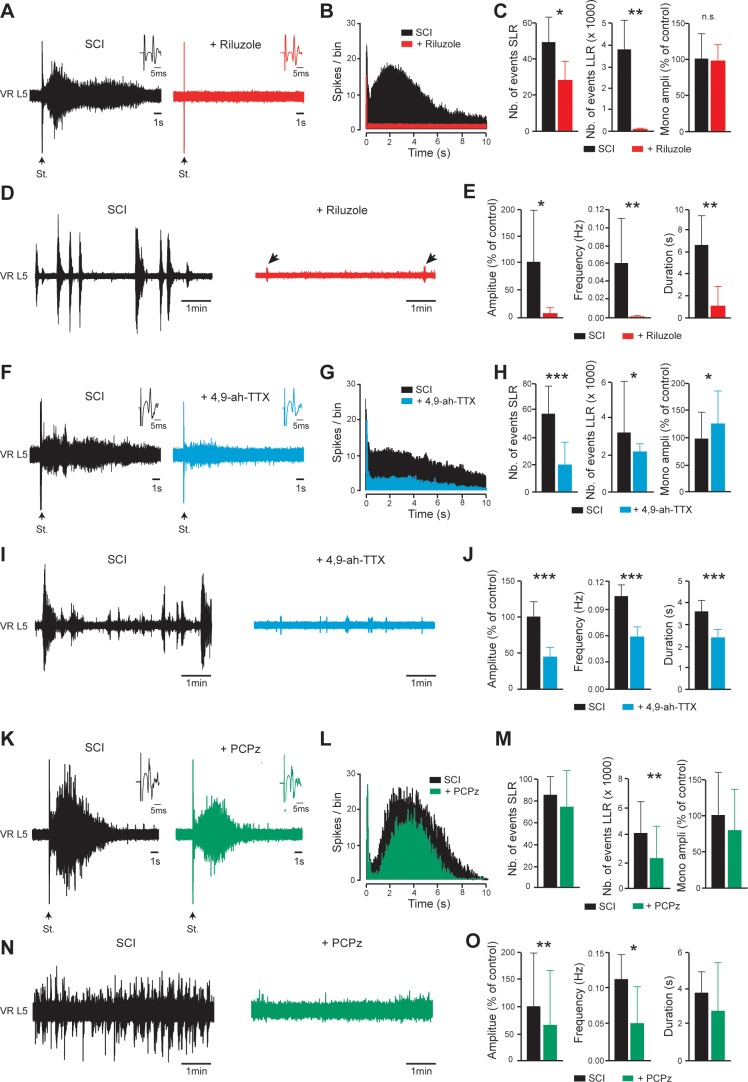
Figure 5. INaP-blockers or a KCC2-enhancer normalize the excitability of the spinal cord below SCI.

(A,D,F,I,K,N) Representative L5 ventral root activities (VR L5) evoked by a supramaximal stimulation (St.) of the ipsilateral dorsal root (A,F,K) or occurring spontaneously (D,I,N) in spinal cords isolated from SCI rats (4–5 d post-SCI) before (black) and after bath-applying 5 µM riluzole (A,D); red, 30 min, n = 8 rats), 200 nM 4,9-ah-TTX (F,I; blue, 30 min, n = 15 rats for F, n = 20 rats for I) or 10 µM PCPz (K,N; green, 30 min, n = 9 rats for K, n = 11 rats for N). Insets in (A,F,K) illustrate enlargements of the monosynaptic response. (B,G,L) Average peristimulus time histogram (PSTH, bin width: 20 ms) of dorsal root evoked L5 ventral root responses before (black) and after (color) bath-applying the above-mentioned drugs. (C,E,H,J,M,O) Group means quantification of: the monosynaptic reflex and events per rat detected over time windows of 10–40 ms and 500–15,000 ms post-stimulus for SLR and LLR, respectively (C,H,M), and spontaneous activities (E,J,O). *p<0.05, **p<0.01, ***p<0.001, comparing data collected before and after adding drugs mentioned above; Wilcoxon paired test. Data are mean ± SD. Underlying numerical values can be found in the Figure 5—source data 1.

Figure 5—source data 1. Values displayed in bar plots shown in Figure 5C, E, H, J, M, O.

Figure 5.

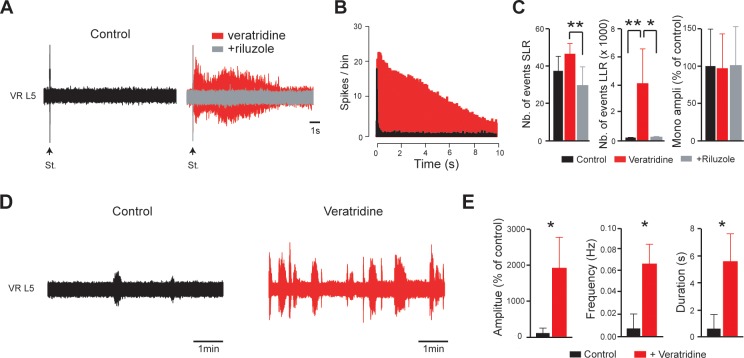
Figure 5—figure supplement 1. The INaP-enhancer veratridine used at 100 nM triggers riluzole-sensitive hyperreflexia and spontaneous activities in isolated spinal cords from intact neonatal rats.

Figure 5—figure supplement 1.

(A,D) Representative L5 ventral root activities (VR L5) evoked by a supramaximal stimulation (St.) of the ipsilateral dorsal root (A) or occurring spontaneously (D) in spinal cords isolated from intact rats (4–5 d-old; n = 8 rats) before (black) and after (red) bath-applying veratridine alone (100 nM) and then superfused with riluzole (5 µM, gray). (B) Average peristimulus time histogram (PSTH, bin width: 20 ms) of dorsal root evoked L5 ventral root. (C) Group means quantification of: the monosynaptic reflex and events per rat detected over time windows of 10–40 ms and 500–15,000 ms post-stimulus for SLR and LLR, respectively. *p<0.05, **p<0.01; One-way ANOVA. (E) Group means quantification of spontaneous activities. *p<0.05; Wilcoxon paired test. Underlying numerical values can be found in the Figure 5—figure supplement 1—source data 1.
Figure 5—figure supplement 1—source data 1. Values displayed in bar plots shown in Figure 5—figure supplement 1C, E.
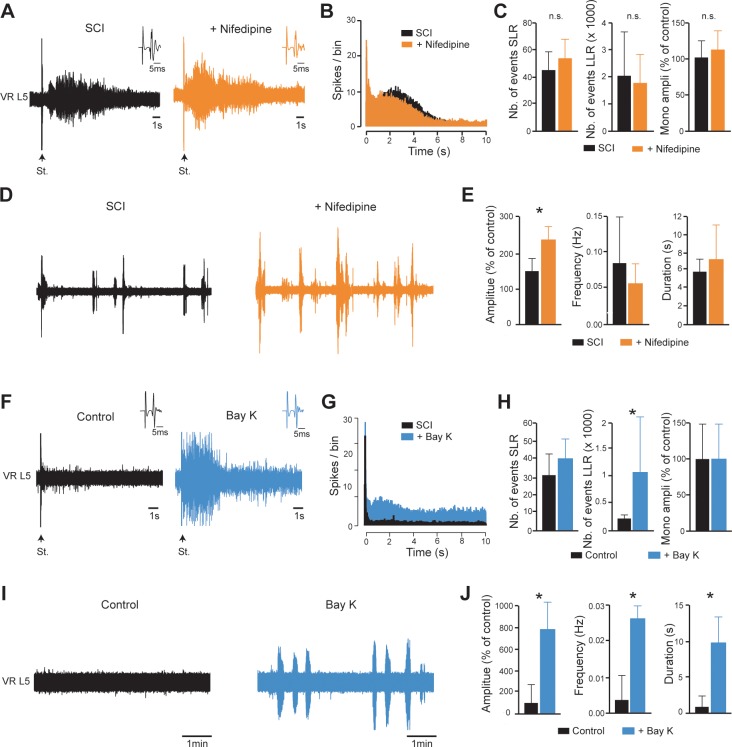
Figure 5—figure supplement 2. ICaP does not contribute to hyperexcitability caudal to SCI.

Figure 5—figure supplement 2.

(A,D,F,I) Representative L5 ventral root activities (VR L5) evoked by a supramaximal stimulation (St.) of the ipsilateral dorsal root (A,F) or occurring spontaneously (D,I) before (black) and after bath-applying 20 µM nifedipine in spinal cords isolated from SCI rats (A,D, 4–5 d post-SCI, orange, 30 min, n = 14 rats), or 10 µM Bay-K in spinal cords isolated from intact rats (F,I, 4–5 d-old, blue, 30 min, n = 7 rats). Insets in A,F illustrate enlargements of the monosynaptic response. (B,G) Average peristimulus time histogram (PSTH, bin width: 20 ms) of dorsal root evoked L5 ventral root responses before (black) and after (color) bath-applying the above-mentioned drugs. (C,E,H,J) Group means quantification of: the monosynaptic reflex and events per rat detected over time windows of 10–40 ms and 500–15,000 ms post-stimulus for SLR and LLR, respectively (C,H), and spontaneous activities (E,J). *p<0.05, **p<0.01, ***p<0.001, comparing data collected before and after adding drugs mentioned above; Wilcoxon paired test. Data are mean ± SD. Underlying numerical values can be found in the Figure 5—figure supplement 2—source data 1.
Figure 5—figure supplement 2—source data 1. Values displayed in bar plots shown in Figure 5—figure supplement 2C, E, H, J.