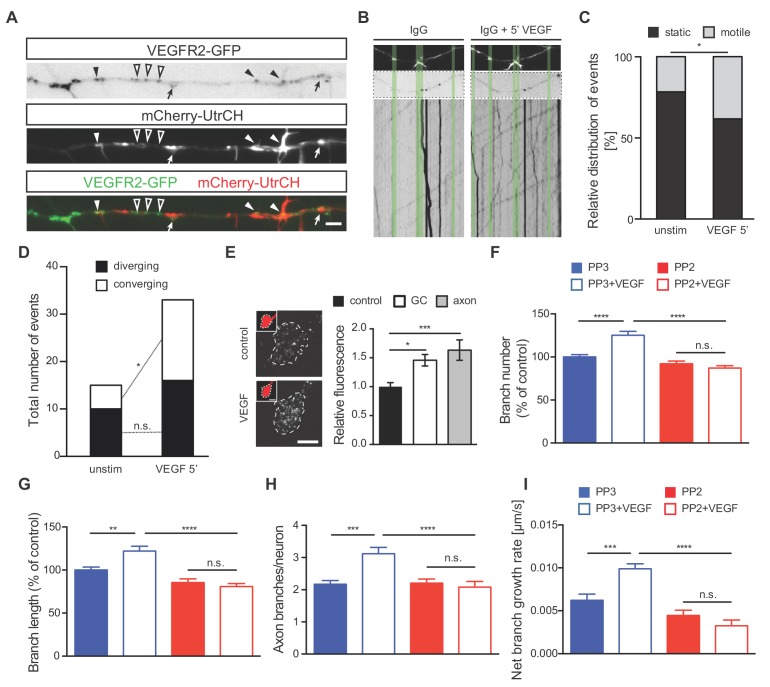
Figure 4. VEGF stimulation induces VEGFR2 motility towards actin-rich protrusions and filopodia and promotes axonal branching in a Src-dependent manner.
(A) Hippocampal neurons were double transfected with mCherry-UtrCH and VEGFR2-GFP plasmids. TIRF microscopy reveals the localization of VEGFR2-GFP punctae at actin nucleation sites (arrows), the base of membrane protrusions and filopodia (black arrowheads) and along axon segments with neither actin nucleation nor protrusion sites (open arrowheads). Scale bar 5 µm. (B–D) To analyze relative VEGFR2-GFP motility and directionality, kymographs of VEGFR2-GFP mobility were generated from time-lapse movies of VEGFR2-GFP and mCherry-UtrCH co-transfected hippocampal neurons (note that IgG treatment is present in these neurons as the movies and kymographs were performed at the same time as the movies and resultant kymographs shown in Figure 4—figure supplement 1 F-H, and thus they serve as the corresponding controls) Upper images shows mCherry-UtrCH status at t = 0 s, middle images shows VEGFR2-GFP at t = 0 s, lower panels shows the kymograph of VEGFR2-GFP over the course of 1 min (B). Relative VEGFR2-GFP motility at protrusions and filopodia (C) as well as the direction of VEGFR2-GFP movement (D) were analyzed over the course of 1 min before and 5 min after VEGF stimulation (100 ng/ml). Per condition,>13 neurons were analyzed of at least three independent experiments. n.s. not significant, *p<0.05; Chi-squared test. (E) Hippocampal neurons were stimulated with or without VEGF and fixed after 5 min. Immunostaining for p-Src was performed and the relative fluorescence was analyzed in the axonal growth cone (GC) or along the axon. Data are represented as mean ± SEM, from at least three independent experiments. *p<0.05; ***p<0.001; One-way ANOVA. (F,G) 1 DIV hippocampal neurons were treated with 1 µM PP2 (a widely used SFK inhibitor) or PP3 (control) for 1 hr prior stimulation with or without 100 ng/ml VEGF for 48 hr. Quantifications of axonal branch number (F) and branch length (G) are shown. Data are represented as % of non-stimulated control. Mean ± SEM of at least three independent experiments. n.s. not significant; **p<0.01; ****p<0.0001; Two-way ANOVA. (H,I) 1 DIV hippocampal neurons were pretreated with 1 µM PP2 or PP3 for 1 hr. After stimulation with 50 ng/ml VEGF or vehicle control time-lapse movies were recorded over the course of 4 hr. The number of extending axon branches is quantified over the course of the movies (H) and the net growth rate of axon branch was calculated (I). Mean ± SEM of at least three independent experiments. n.s. not significant; ***p<0.001; ****p<0.0001; Two-way ANOVA.


