. 2019 Dec 23;8:e49818. doi: 10.7554/eLife.49818

Figure 5. Nes-cre;Kdrlox/-mice show defects in axon branching and synapse density in vivo.

(A) Representative tracings in the CA1 stratum radiatum of CA3 DiI labeled axons from P10 control and Nes-cre;Kdrlox/- mice. Selected individual axon traces are shown highlighted in different colors in the panels below. Scale bar 100 µm. (B,C) Quantification of the axon branch number per 100 µm axon length (B) as well as their length distribution (C). Data are represented as mean ± SEM from n = 15 control and n = 18 Nes-cre;Kdrlox/- pups of 6 independent litters (B,C). n.s. not significant; *p<0.05; **p<0.01; unpaired Student’s ttest. (D) Representative electron micrographs of the hippocampal CA1 stratum radiatum from P10 control and Nes-cre;Kdrlox/- mice. Red arrowheads indicate synapses. Scale bar 1 µm. (E) Quantification of synapse density in control and Nes-cre;Kdrlox/- mice. Synapse numbers from 8 fields of view of n = 4 mice from each genotype were analyzed. *p<0.05; unpaired Student’s ttest. (F,G) Average mEPSC frequency (F) and amplitude (G) in control and Nes-cre;Kdrlox/- mice. n.s. not significant; **p<0.01; unpaired Student’s ttest. (H) Representative mEPSC recordings in control and Nes-cre;Kdrlox/- mice.

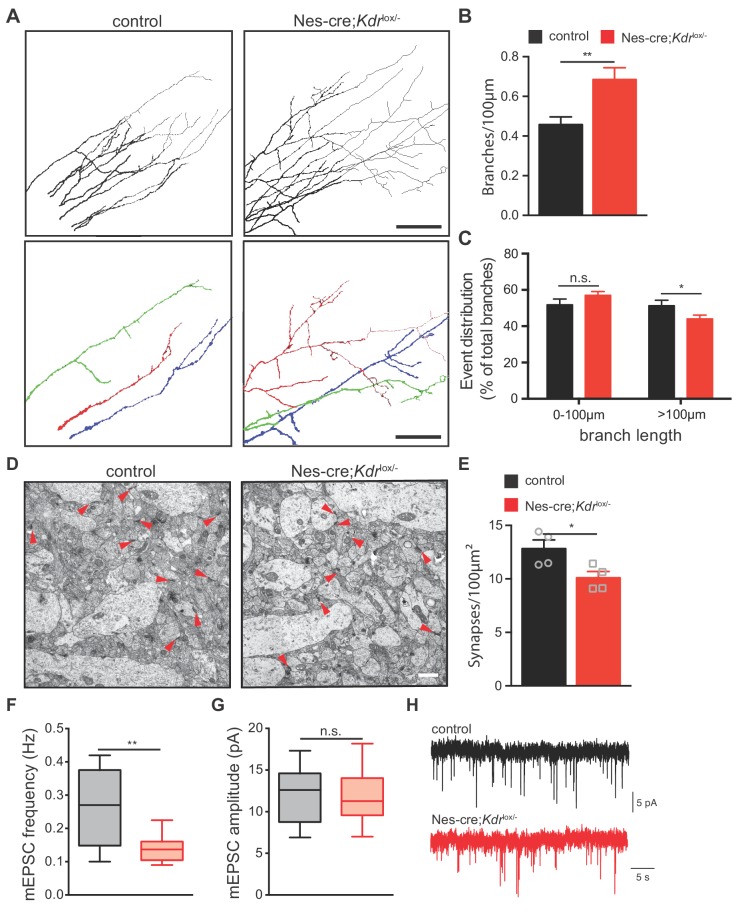
Figure 5—source data 1. Raw data and statistical analysis of graphs of Figure 5.

Figure 5.

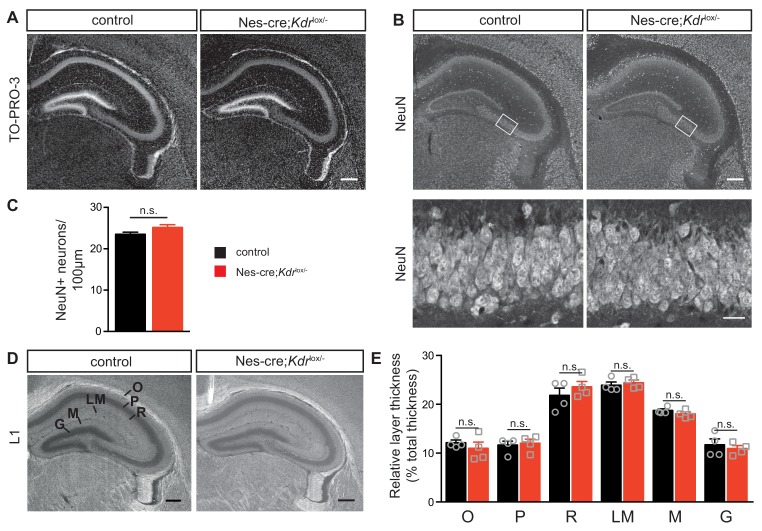
Figure 5—figure supplement 1. Nes-cre;Kdrlox/- mice do not show defects in the overall hippocampal morphology and cytoarchitecture.

Figure 5—figure supplement 1.

(A–C) Hippocampal section of P10 control and Nes-cre;Kdrlox/-mice were stained with TO-PRO-3 and NeuN and the number of NeuN neurons was counted per 100 µm in the CA3 region of the hippocampus (C). Insets with higher magnifications of CA3 area (insets in B) are shown in the lower panel. Scale bar 100 µm or 20 µm, respectively. n.s. not significant, unpaired Student’s ttest. (D,E) Hippocampal section of P10 control and Nes-cre;Kdrlox/- mice were stained with L1 and relative layer thickness of stratum oriens (O), stratum pyramidale (P), stratum radiatum (R), stratum lacunosum-moleculare (LM), stratum moleculare (M) and stratum granulosum (G) were measured. Data are shown as % of total thickness, mean ± SEM from at least three mice. Scale bar 100 µm. n.s. not significant, unpaired Student’s ttest.
Figure 5—figure supplement 1—source data 1. Raw data and statistical analysis of graphs of Figure 5—figure supplement 1.
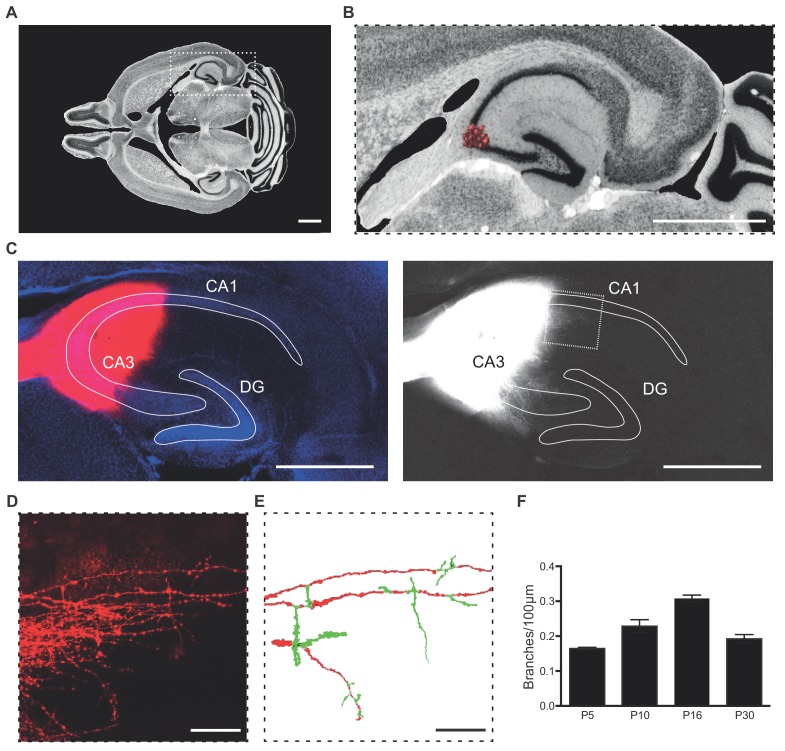
Figure 5—figure supplement 2. Experimental setup for DiI labeling of CA3 axons in ex vivo slices.

Figure 5—figure supplement 2.

(A–E) Thick horizontal vibratome sections of postnatal brains were prepared (A). A small DiI crystal was placed in the stratum pyramidale of the CA3 region (B). Short incubation with the DiI crystals allowed the labeling of a small number of CA3 axons and the identification of single axon segments and their branches. Labeled CA3 axons were imaged and traced in the stratum radiatum of the CA1 region where they project to (C–E). Pictures were taken from MBL Mouse Brain Atlas (http://www.mbl.org/mbl_main/atlas.html, A,B). Scale bar 1 mm (A,B), 500 µm (C) and 100 µm (D,E). (F) Axon branching of CA3 neurons was analyzed in different postnatal developmental stages of wildtype mice. Data are shown as mean ± SEM from at least three mice.
Figure 5—figure supplement 3. VEGF/VEGFR2-mediated regulation of axon branching does not require Nrp1.

Figure 5—figure supplement 3.

(A) ISH of Nrp1 mRNA in the hippocampus at E18.5, P4 and P8. Scale bars 250 µm. (B,C) Quantification of the branch number (B) and branch length (C) of control and α-Nrp1 treated neurons at 3 DIV. Data are represented as % of control, mean ± SEM, from at least three independent experiments. **p<0.01; ***p<0.001; ****p<0.0001; two-way ANOVA. (D,E) Quantification of the branch number (D) and branch length (E) of control, α-VEGFR2 and α-VEGFR2+α- treated neurons at 3 DIV. Data are represented as % of control, mean ± SEM, from at least seven independent experiments. n.s. not significant; **p<0.01; one-way ANOVA.
Figure 5—figure supplement 3—source data 1. Raw data and statistical analysis of graphs of Figure 5—figure supplement 3.
Figure 5—figure supplement 4. VEGF/VEGFR2-mediated regulation of axon branching requires active endocytosis but not EphrinB2.

Figure 5—figure supplement 4.

(A,B) 1 DIV hippocampal neurons were pre-treated with 80 µM dynasore or equal volume DMSO vehicle control for 30 min and subsequently stimulated with 50 ng/ml VEGF or vehicle control. Time-lapse movies were recorded over the course of 4 hr. The number of extending axon branches was quantified over the course of the movies (A) and the net growth rate of axon branch was calculated (B). Data represents mean ± SEM from 32 neurons, n = 3 independent experiments. n.s. not significant; *p<0.05; ***p<0.001; ****p<0.0001; two-way ANOVA. (C,D) Quantification of the branch number (C) and branch length (D) of control and Efnb2-/- neurons at 3 DIV. Data are represented as % of control, mean ± SEM, from at least five independent experiments. *p<0.05; **p<0.01; ****p<0.0001; two-way ANOVA. (E) CA3 axons from P10 control and Nes-cre;Kdrlox/+;Efnb2lox+- mice were labels using DiI and axon branches were analyzed in CA1 stratum radiatum. Quantification of the axon branch number per 100 µm axon length (E). Data are represented as mean ± SEM from n = 16 control and n = 20 Nes-cre;Kdrlox/+-;Efnb2lox/+- pups of 6 independent litters. n.s. not significant; unpaired Student’s ttest.
Figure 5—figure supplement 4—source data 1. Raw data and statistical analysis of graphs of Figure 5—figure supplement 4.