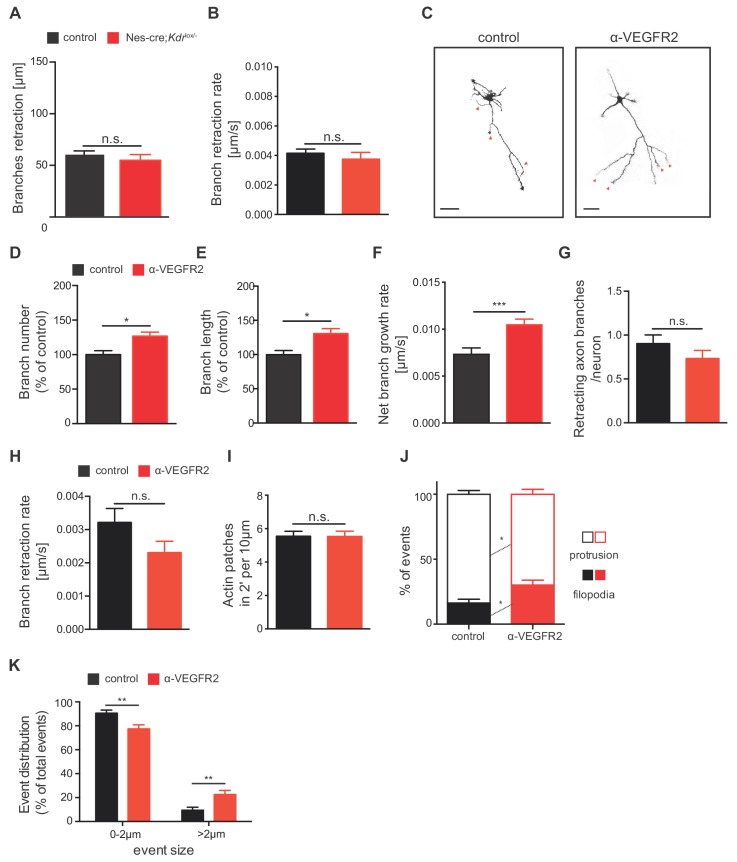
Figure 6. VEGFR2 deficiency in hippocampal neurons promotes axonal branching by increasing filopodia formation.
(A) Representative images of 3 DIV hippocampal neurons isolated from control and Nes-cre;Kdrlox/- embryos and stained beta-III tubulin. Axon branches are indicated by red arrowheads. Scale bars 50 µm. (B,C) Quantification of the axon branch number (B) and branch length (C) of control and Nes-cre;Kdrlox/- neurons at 3 DIV. Data are represented as % of control. Mean ± SEM,>120 neurons from n = 6. ****p<0.0001; unpaired Student’s ttest. (D,E) Time-lapse movies over the course of 4 hr were recorded from 1 DIV hippocampal neurons of control and Nes-cre;Kdrlox/- mice. The net axon branch growth was quantified over the course of the movies (D) and the growth rate of axon branch was calculated (E). Data represents mean ± SEM of at least three independent experiments. *p<0.05; unpaired Student’s ttest. (F) The number of newly forming actin patches during 2 min per 10 µm axon segment was counted in neurons of control and Nes-cre;Kdrlox/- mice. Data represents mean ± SEM of at least three independent experiments. n.s. not significant; unpaired Student’s ttest. (G,H) The number (G) and the size (H) of newly formed protrusions and filopodia was analyzed during the course of 10 min in neurons of control and Nes-cre;Kdrlox/- mice. Data represents mean ± SEM of at least three independent experiments. *p<0.05; **p<0.01; unpaired Student’s ttest.


