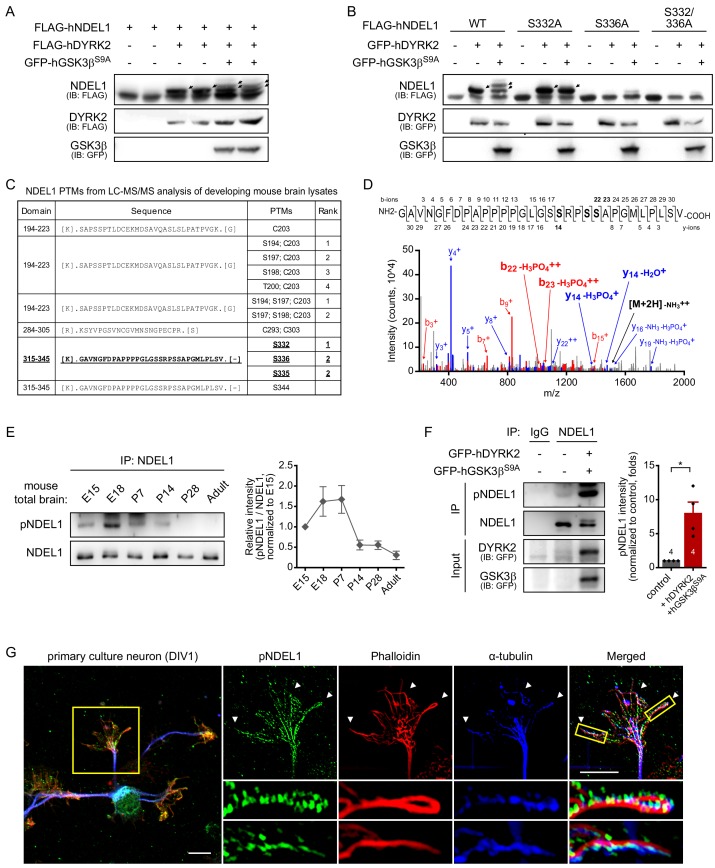
Figure 1. DYRK2 and GSK3β induce sequential phosphorylation of NDEL1 at S336 and S332.
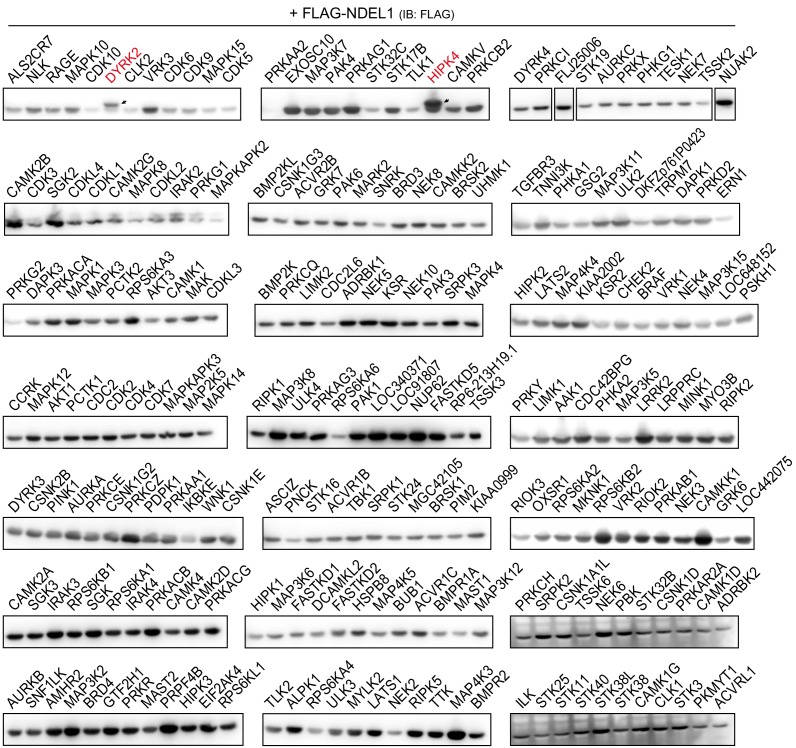
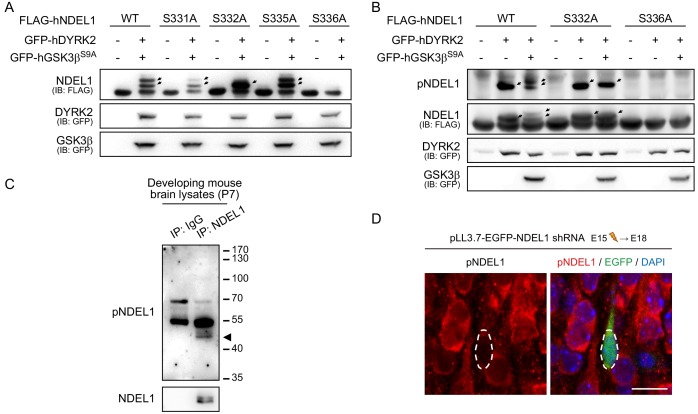
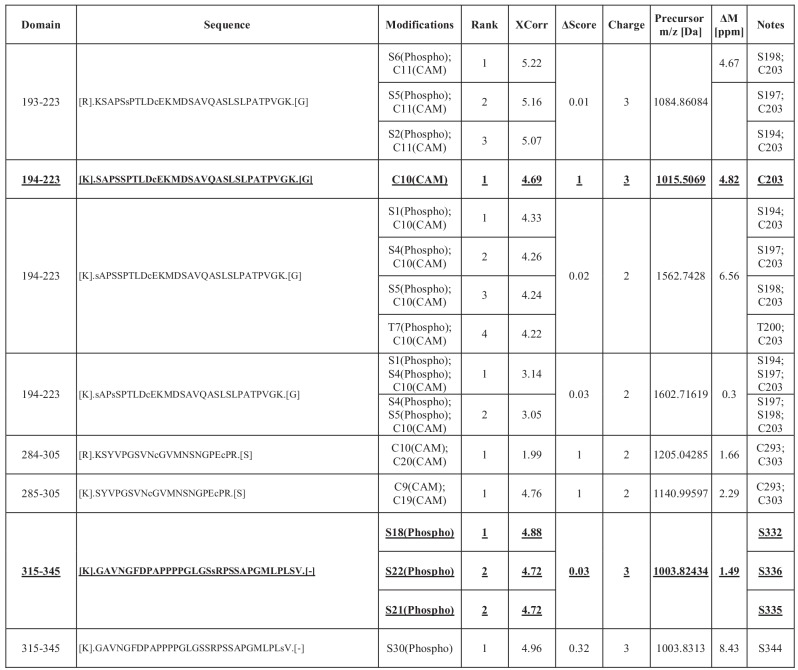
(A) Identification of responsible kinases for NDEL1 phosphorylation. DYRK2, one of the positive candidates from human kinome screening for NDEL1 phosphorylation, and GSK3βS9A sequentially phosphorylated NDEL1. (B) Identification of NDEL1 S336 and S332 as target sites of DYRK2 and GSK3β. DYRK2 increased NDEL1 phosphorylation at S336 and GSK3βS9A additionally induced phosphorylation at S332. (C) List of NDEL1 PTMs identified from LC-MS/MS analysis of developing mouse brain lysates. Peptide containing S336 and S332 phosphorylation is indicated by bold and underlined letters. (D) MS/MS spectrum for the phosphorylated fragments of NDEL1 peptide including S332 and S336 residues. The sequence of the peptide (aa 315–345) and all detected fragment ions are shown above. The b- and y-ions annotated in the spectrum include the sizes of y14 and b22 ions indicative of phosphorylation at S332 or S336. (E) Phosphorylation levels of endogenous NDEL1 S336/S332 in the developing mouse brain. Amount of lysates subjected to IP was normalized by NDEL1 protein levels. N = 7 for E15, P7, P14, P28, and adult brain lysates and N = 6 for E18. All results are presented as means ± SEM. (F) Increased endogenous NDEL1 phosphorylation by DYRK2 and GSK3β. Transfected HEK293 cell lysates were IPed with pan-NDEL1 antibody followed by western blot with anti-pNDEL1 antibody. Over-expression of DYRK2 and GSK3βS9A increased the endogenous NDEL1 S336/S332 phosphorylation. The number of samples is shown at the bottom of the bar of the graph. All results are presented as means ± SEM. *p<0.05 from Student’s t-test. (G) Endogenous NDEL1 S336/S332 phosphorylation detected at the growth cone of the primary cultured mouse hippocampal neuron. Anti-pNDEL1 antibody signal was enriched at the growth cone and colocalized with both phalloidin and α-tubulin (indicated by arrowheads). Magnified confocal images show the strong overlap between pNDEL1, phalloidin, and α-tubulin. The scale bar represents 10 μm. See also Figure 1—figure supplements 1, 2 and 3 and Figure 1—source data 1 and 2.


