. 2019 Dec 9;8:e50850. doi: 10.7554/eLife.50850

Figure 3. Phosphorylation of NDEL1 S336/S332 regulates dendritic arborization of cortical pyramidal neurons.

(A–E) Suppression of NDEL1 S336/S332 phosphorylation disrupted dendritic arborization of layer II/III pyramidal neurons. All constructs were electroporated in utero to E15 mouse brain and then P14 brain was subjected for analysis. All of NDEL1 over-expressing constructs here contain an shRNA-resistant mutation. (A) Representative images of the brain slices with the tracked neuron (above) and the overlapped dendritic structures of five independent neurons (bottom). Sholl analysis plots (B), the total length of dendrites (C), the total number of branches (D), and the number of primary/secondary/tertiary dendrites (E) were analyzed by using Simple neurite tracer plug-in of ImageJ software. White arrowheads in (A) indicate neurons with migration defect. (F–J) NDEL1 S336/S332 phosphorylation induced by DYRK2-GSK3β kinases increased dendritic arborization of layer II/III pyramidal neurons. All constructs were electroporated in utero to E15 mouse brain and P14 brain was subjected for analysis. (F) Representative images of the brain slices with the tracked neuron (above) and the overlapped dendritic structures of five independent neurons (bottom). Sholl analysis plots (G), the total length of dendrites (H), the total number of branches (I), and the number of primary/secondary/tertiary dendrites (J) were analyzed by using Simple neurite tracer plug-in of ImageJ software. Each n number is shown at the bottom of the bar of the graph. Scale bars represent 100 μm. All results are presented as means ± SEM. *p<0.05, **p<0.01, and ***p<0.001 from one-way ANOVA for (C), (D), (H), and (I) and two-way ANOVA for (B), (E), (G), and (J). All brain samples for each group were collected from offspring of at least three independent in utero electroporation surgeries. See also Figure 3—figure supplement 1, Figure 3—videos 1 and 2, and Figure 3—source data 1 and 2.

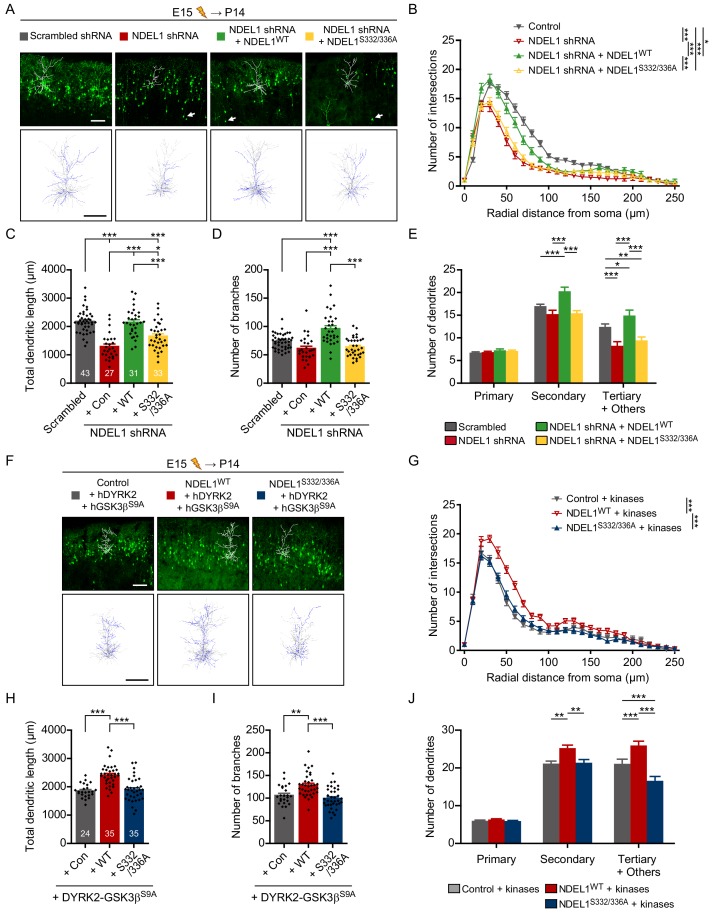
Figure 3—source data 1. Source data for dendritic arborization of NDEL1 knockdown and rescue groups.
Figure 3—source data 2. Source data for dendritic arborization of NDEL1 and kinases over-expression groups.

Figure 3.

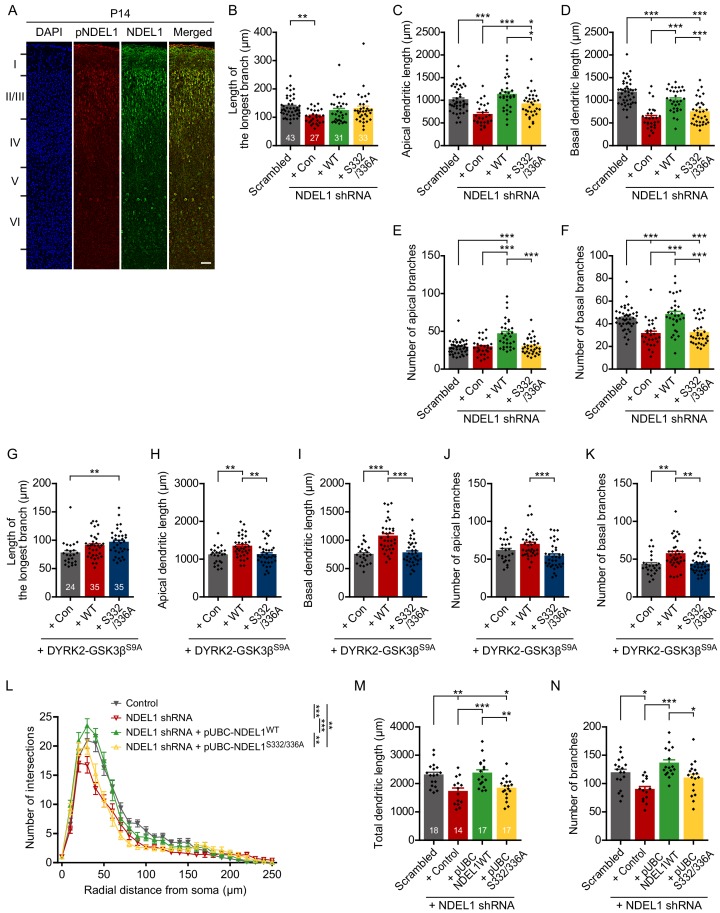
Figure 3—figure supplement 1. Figure for additional data on dendritic arborization.

Figure 3—figure supplement 1.

(A) Immunohistochemistry for endogenous NDEL1 and its S336/S332 phosphorylation from the P14 mouse brain slice. Both NDEL1 and pNDEL1 were highly expressed from neurons in cortical layer II/III. (B–F) Additional data related to Figure 3A–E. The longest branch length (B), the apical dendrite length (C), the basal dendrite length (D), the number of apical branches (E), and the number of basal branches (F) were measured by using Simple neurite tracer plug-in of ImageJ software. (G–K) Additional data related to Figure 3F–J. The longest branch length (G), the length of apical dendrites (H), the length of basal dendrites (I), the number of apical branches (J), and the number of basal branches (K) were measured by using Simple neurite tracer plug-in of ImageJ software. (L–N) NDEL1 expression under UBC promoter was sufficient to rescue the decreased dendritic arborization of layer II/III pyramidal neurons caused by NDEL1 knockdown. All constructs were electroporated in utero into E15 mouse brain and P14 brains were subjected to analysis. Sholl analysis plots (L), the total length of dendrites (M), and the total number of branches (N) were analyzed by using Simple neurite tracer plug-in of ImageJ software. Each n number is shown at the bottom of the bar of the graph. The scale bar at (A) represents 50 μm All results are presented as means ± SEM. *p<0.05, **p<0.01, and ***p<0.001 from one-way ANOVA for (B–K), (M), and (N) and two-way ANOVA for (L). All brain samples for each group were collected from at least three independent in utero electroporation surgeries.
Figure 3—video 1. Video for 3D reconstructions of the dendritic structures of representative neurons, related to Figure 3A.
Download video file (456.1KB, mp4)
Figure 3—video 2. Video for 3D reconstructions of the dendritic structures of representative neurons, related to Figure 3F.
Download video file (391.1KB, mp4)