. 2019 Dec 10;8:e52384. doi: 10.7554/eLife.52384

Figure 2. Neutralization profile of antibodies.

(A) Representative antibody dose-response neutralization curves against DENV1-4, ZIKV, and WNV reporter viruses. Infectivity levels were normalized to those observed in the absence of antibody. Data points and error bars indicate the mean and range of duplicate wells, respectively. Results are representative of at least three independent experiments. (B) Antibody concentrations resulting in 50% inhibition of infectivity (IC50) from dose-response neutralization experiments described in (A). Values represent the mean of at least three independent experiments, each performed in duplicate and summarized in Figure 2—source data 1. The heatmap indicates neutralization potency, as defined in the key. Gray boxes indicate that 50% neutralization was not achieved at the highest antibody concentration tested (10 μg/ml). The patient (Pt) from which antibodies were isolated are indicated above each antibody name. Antibodies from shared clonal families are indicated above patient ID.

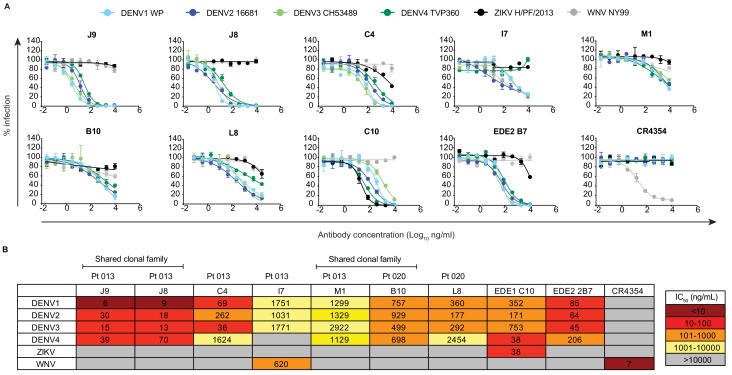
Figure 2—source data 1. Antibody IC50 values against a panel of reporter flaviviruses from replicate experiments.

Figure 2.

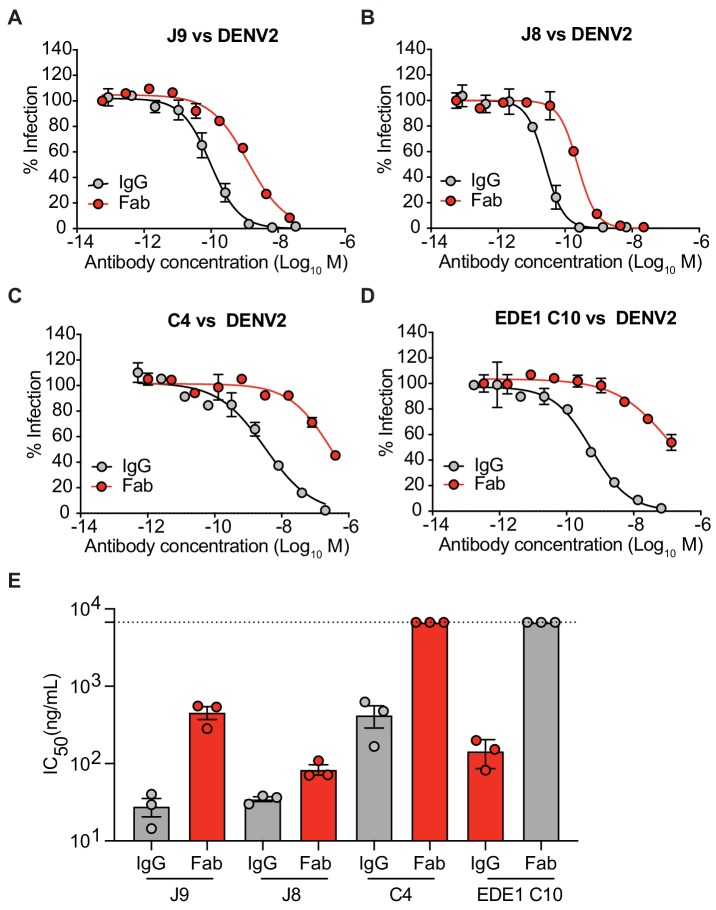
Figure 2—figure supplement 1. Neutralization potency of IgG and Fab fragments.

Figure 2—figure supplement 1.

(A) J9, (B) J8, (C) C4, and (D) EDE1 C10 were tested as Fab fragments or full-length IgG for neutralization of DENV2 reporter virus. Dose-response neutralization curves represent three independent experiments, each performed in duplicate. Data points and error bars indicate the mean and range of duplicate wells, respectively. (E) Mean IC50 values of the indicated IgG or Fab fragment from three independent experiments represented by data points. Error bars represent the SD. Values at the dotted horizontal line indicates that 50% neutralization was not achieved at the highest concentration of Fab tested. Fabs were tested at 2x excess molar concentration relative to IgG.
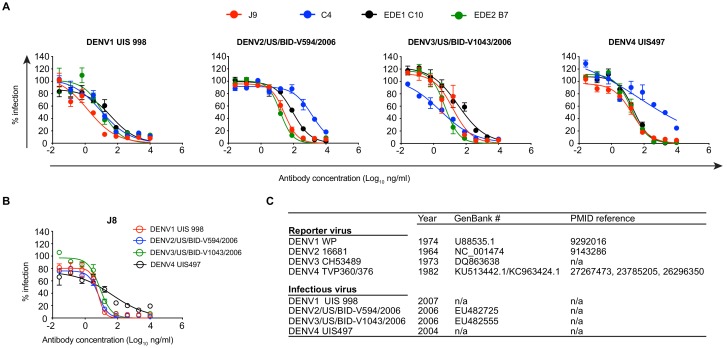
Figure 2—figure supplement 2. Neutralization potency of antibodies against fully infectious DENV1-4 strains.

Figure 2—figure supplement 2.

Neutralization of fully infectious DENV1-4 strains by (A) J9, C4, EDE1 C10, EDE2 B7, and (B) J8 was determined by intracellular staining with AF488-conjugated anti-E protein 4G2 antibody at 48 hr post-infection. Error bars indicate the range of duplicate infections. Infectivity levels were normalized to those in the absence of antibody. Dose-response neutralization curves represent one experiment. (C) Comparison of fully infectious DENV strains used in (A) and (B) to DENV reporter viruses used in our study. For each virus, the year of isolation is listed, as well as the GenBank Accession number and PMID reference, if available. The nucleotide sequence of the structural genes (C, prM, E) used to make DENV4 TVP-360 (GenBank # KU513442.1) reporter virus is identical to that of DENV4 TVP-376 (GenBank # KC963424.1) with the exception of a silent mutation in the stem region of the E protein.
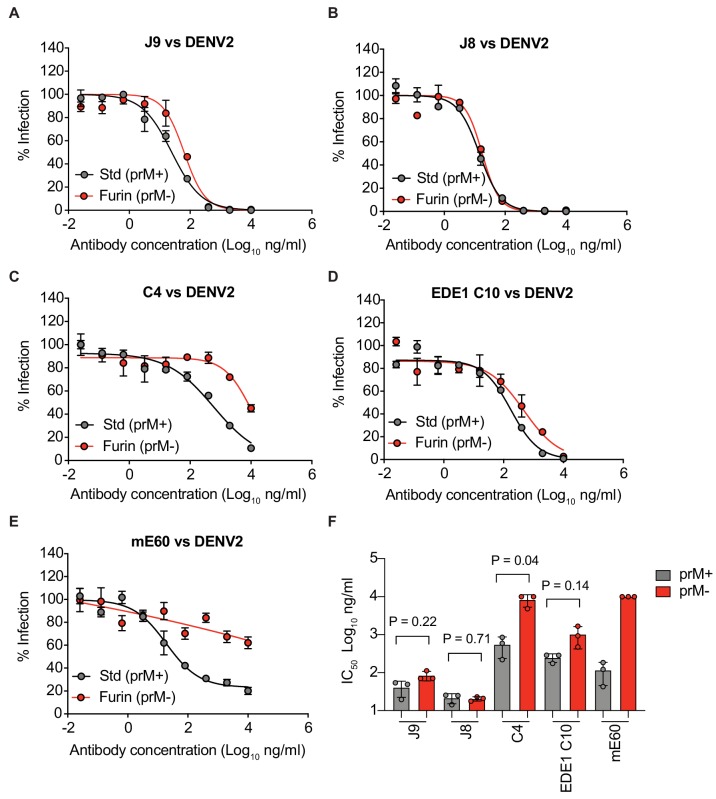
Figure 2—figure supplement 3. Antibody neutralization of standard and mature reporter virus preparations.

Figure 2—figure supplement 3.

(A) Dose-response neutralization curves for the indicated antibodies against DENV2 reporter virus prepared under standard conditions (Std) or in the presence of overexpressed furin to generate mature (Furin) virus particles. Data points and error bars indicate the mean and range of infectivity in duplicate wells, respectively. (B) Mean IC50 values of antibodies against standard or mature reporter viruses from three independent experiments depicted by data points. Error bars indicate the SD. P-values were obtained from two-tailed paired t-tests.
Figure 2—figure supplement 4. Mechanism of neutralization.

Figure 2—figure supplement 4.

Representative dose-response curves for neutralization of DENV2 16681 reporter virus pre- (filled symbols, solid lines) or post-attachment (open symbols, dotted lines) to Raji-DCSIGNR cells by the antibodies indicated above each graph. Results are representative of at least two independent experiments each performed in duplicate. Data points and error bars indicate the mean and range of duplicate wells, respectively.