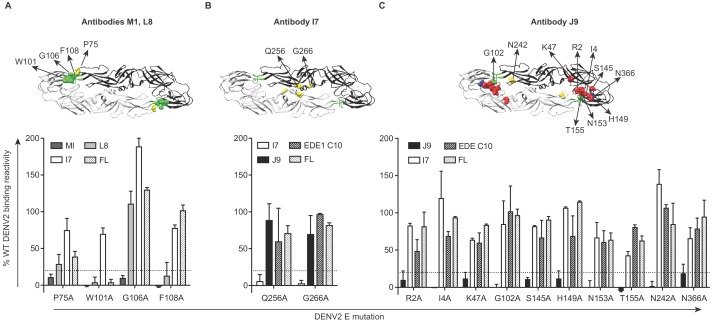
Figure 4. Critical E protein residues for antibody binding.
Individual alanine mutations of a subset of DENV2 E residues decreased binding by antibodies (A) M1 and L8, (B) I7 or (C) J9 as shown, but did not affect binding by other antibodies, including EDE1 C10 and a previously screened control antibody (FL) targeting the fusion loop (unpublished). Above each graph, residues involved in binding of the indicated antibodies are highlighted on the ribbon structure of one of the monomers (black) within the DENV2 E dimer (PDB: 1OAN). Residues in DI, DII, DIII, and DII fusion loop are indicated in red, yellow, blue, and green, respectively. For each graph, the x-axis indicates the DENV2 E protein mutation and the y-axis displays antibody binding reactivity to the mutant as a percentage of WT DENV2 reactivity. Binding reactivity to the complete mutagenesis library can be found in Figure 4—source data 1. Error bars represent the mean and range of at least two independent experiments. The dotted horizontal line indicates 80% reduction in antibody binding reactivity to mutant compared to WT DENV2.

