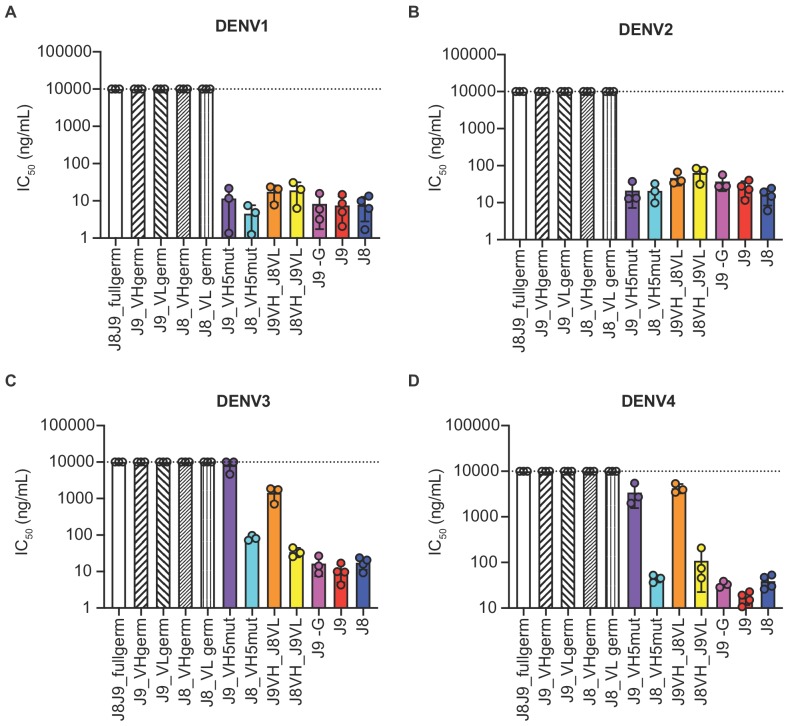
Figure 7. Contribution of VH and VL somatic hypermutation to J9 and J8 neutralizing activity.
For each antibody indicated on the x-axis, bars represent mean IC50 values obtained from 3 to 4 independent experiments indicated by data points against (A) DENV1, (B) DENV2, (C) DENV3, and (D) DENV4 reporter viruses. Error bars show the SD. Values at the dotted horizontal line in each graph indicates that 50% neutralization was not achieved at the highest IgG concentration tested (10 µg/ml). IC50 values for fully mature J9 and J8 are shown in red and blue bars, respectively. J8J9_full germ: germline J8/J9 VH paired with germline J8/J9 VL; J9_VHgerm: J9 germline VH paired with J9 mature VL; J9VL_germ: J9 mature VH paired with J9 germline VL; J8_VHgerm: J8 germline VH paired with J8 mature VL; J8_VLgerm: J8 mature VH paired with J9 germline VL; J9_VH5mut: J9 VH with five mutations indicated in yellow in Figure 6B paired with J9 mature VL; J8_VH5mut: J8 VH with five mutations indicated in yellow in Figure 6B paired with J8 mature VL; J9VH_J8VL: J9 mature VH paired with J8 mature VL; J8VH_J9VL: J8 mature VH paired with J9 mature VL; J9 -G: J9 VH with a single glycine deletion in FR2 paired with mature J9 VL.


