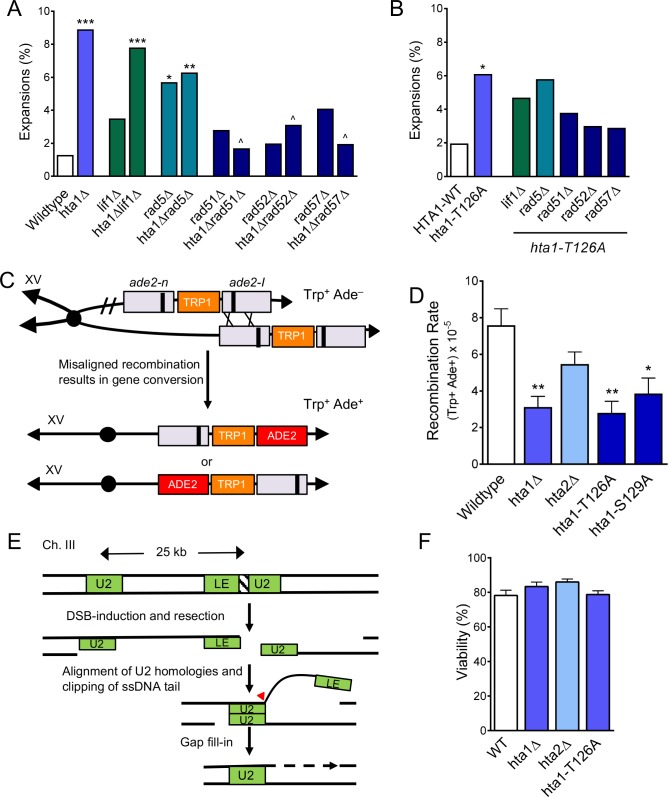
Figure 4. H2A.1 promotes HR fidelity to prevent (CAG)85 expansions and is required for efficient SCR.
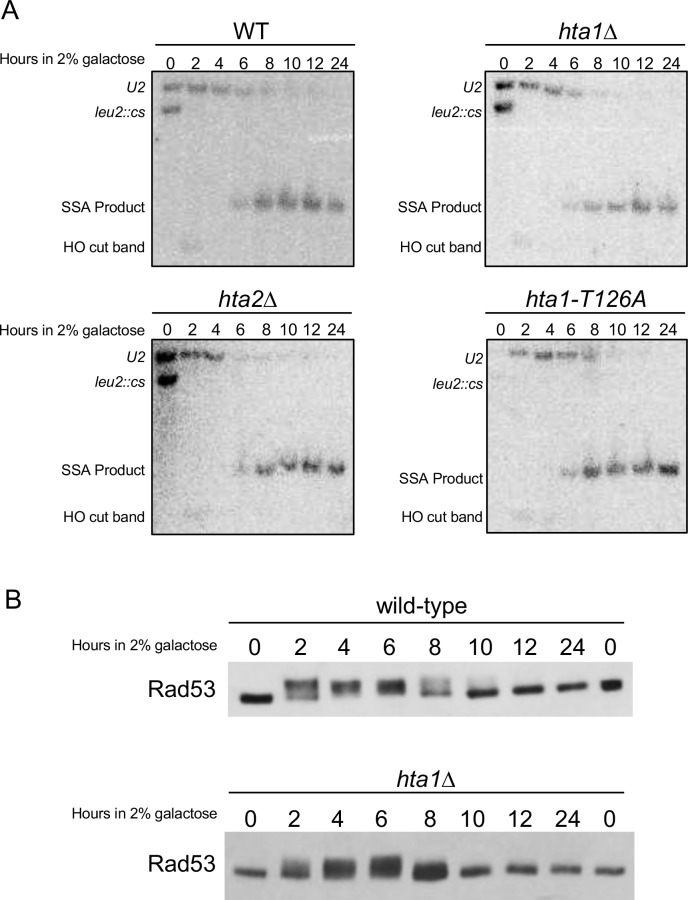
(A) Repair proteins were deleted in hta1Δ mutant. Changes in CAG repeat length were assessed as in Figure 1C. Statistical deviations were calculated by Fisher’s Exact Test: *p<0.05 to WT, **p<0.01 to WT, ***p<0.001 to WT; ^p<0.05 suppression from hta1Δ. (B) Repair proteins were deleted in the strain expressing hta1-T126A from the plasmid; no copy of H2A.2 is present in these cells. Changes in CAG repeat length were assessed as in (A). Statistical deviation from the plasmid HTA1 wild-type were calculated by Fisher’s Exact Test: *p<0.05; statistical deviation from the plasmid hta1-T126A was also tested, but none were significantly suppressed. (C) Misaligned recombination during SCR can be measured by gene conversion from Trp+ Ade– to Trp+ Ade+ (House et al., 2014b; Mozlin et al., 2008). If recombination occurs on either side of the ade2-n and ade2-I mutations (indicated by X’s) between aligned mutant alleles, then gene conversion will create a WT ADE2 gene on one of the chromatids. The ade2-I gene conversion resulting from the indicated cross is shown directly below the arrow; an alternate alignment and gene conversion of the ade2-n allele is also possible (bottom chromosome). (D) Rates of spontaneous unequal SCR. For these experiments, the hta1-T126A and hta1-S129A mutations were integrated at the genomic locus, replacing the wild-type copy of HTA1; HTA2 remains intact in these strains. SCR rates for individual experiments are in Supplementary file 5, including for the HTA1 point mutants with HTA2 deleted (presence or absence of HTA2 did not change the results). Average rate and SEM is shown. Statistical differences were calculated using a Student’s t-test: *p<0.05 to WT, **p<0.01 to WT. (E) SSA at a DSB can be measured by viability in the presence of a galactose-induced HO DSB. Upon galactose treatment a DSB at the inserted HO cut site in the LEU2 gene results in resection to the U2 region of homology 25 kB away. Repair occurs via single strand annealing between the U2 segments followed by cleavage of the non-homologous tail (arrowhead) and gap filling (dotted lines), eliminating the HO target site, and cells survive in the presence of galactose (Vaze et al., 2002). (F) Percent viability as measured by the number of colonies on YP-Gal divided by the number of colonies on YPD. Statistical deviation from wild-type was tested by a Student’s t-test; none were significantly different from wild-type (Supplementary file 6).


