Figure 1. Super-resolution microscopy of fast-spiking, PV+ interneuron axons.
(a) Experimental approach. Biocytin-filled fast-spiking PV+ interneurons from mPFC were analyzed using both confocal imaging and structured illumination microscopy (SIM) imaging. See also Figure 1—figure supplements 1–3. (b) Maximum projection confocal image of a representative biocytin-filled PV+ cell from mPFC layer V (red). Scale bar, 50 µm. (c) Current clamp recording of evoked action potentials. Scale bars are 20 mV, 100 pA and 100 ms from top to bottom (right). (d) Full reconstruction of a mPFC layer V PV+ interneuron. Soma and dendrites in black, axon in brown. (e) Representative SIM z-stack projections of PV+ interneuron axonal segments (top), along with their corresponding FWHM diameter profiles (bottom). White arrowheads indicate measurement boundaries. From left to right: First branch order axon initial segment; second branch order unmyelinated axonal segment; third branch order myelinated axonal segment; sixth branch order unmyelinated axonal segment featuring multiple en-passant boutons (indicated by asterisks). Scale bar, 10 µm. (f) Distribution histogram of PV+ interneuron axon shaft diameters, fitted with a Gaussian curve. n = 140 axonal segments/8 cells. (g) Average axon shaft diameter decreases steadily over centrifugal branch order. n = 140 segments/8 cells. p<0.001, one-way ANOVA. (h) Distribution of axonal en passant bouton diameters of PV+ interneuron axons, fitted with a Gaussian curve. n = 250 boutons/8 cells. Abbreviations: FWHM, full-width half-maximum. I, input current. SIM, structured illumination microscopy. Vm, membrane voltage.

Figure 1—figure supplement 1. Experimental flowchart for axonal reconstructions.

Figure 1—figure supplement 2. Axonal diameter analysis.

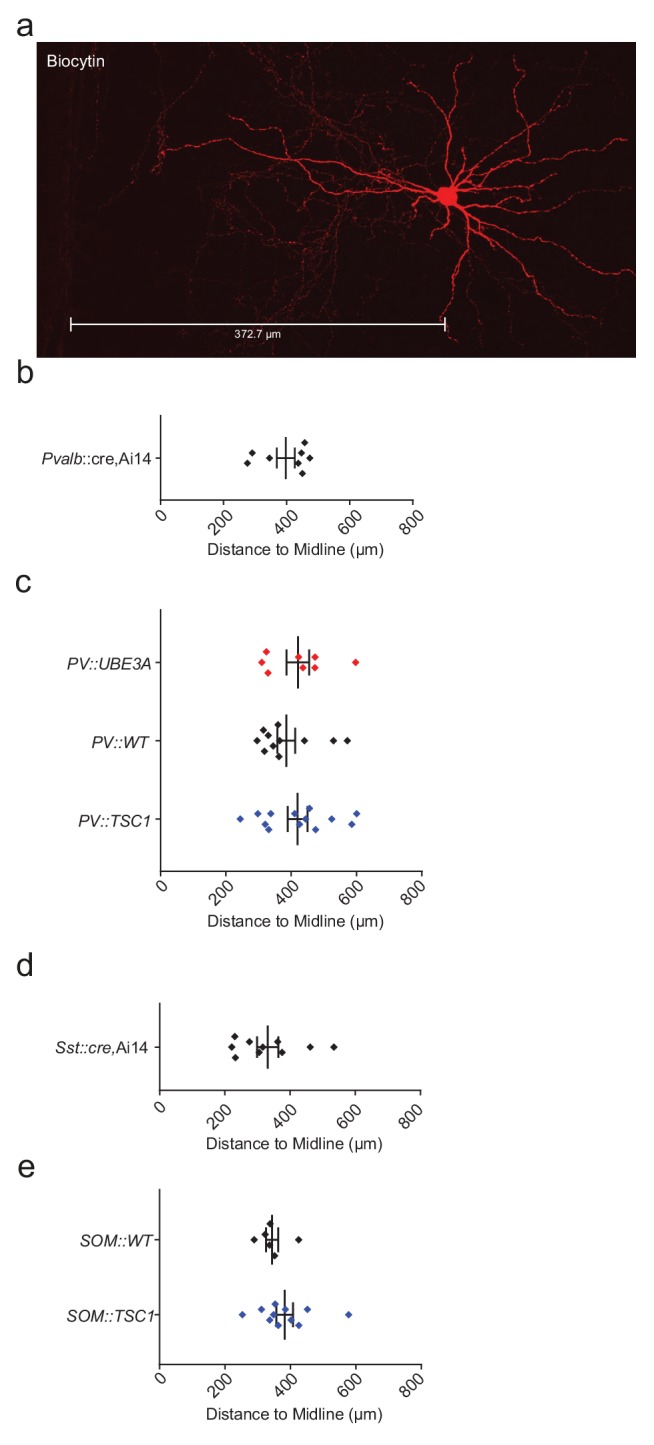
Figure 1—figure supplement 3. Locations of biocytin-filled and reconstructed PV+ and SOM+ cells.