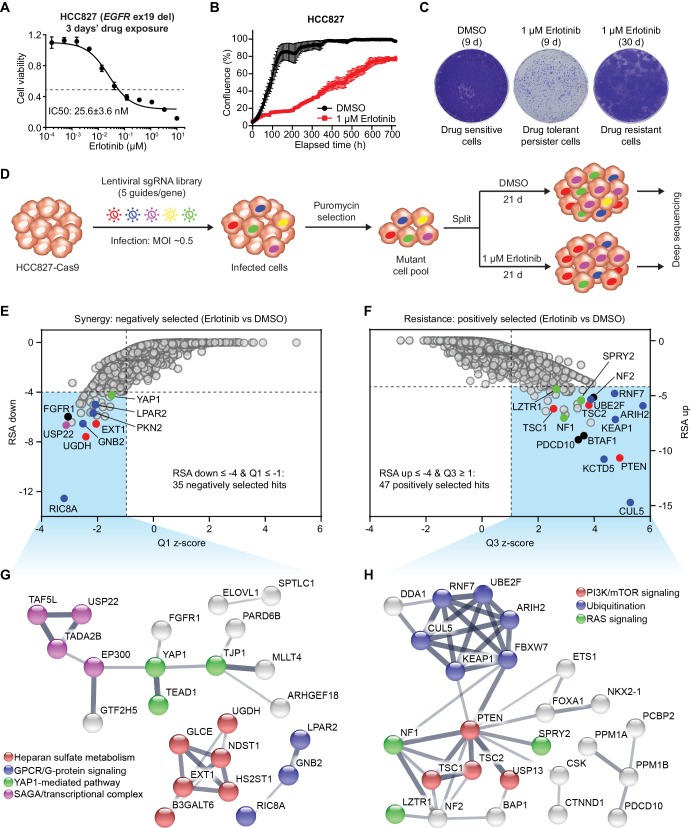
Figure 1. Genome-wide CRISPR-Cas9 screening identifies determinants of EGFR-TKI sensitivity in EGFR-mutant NSCLC.
(A) Cell viability assessment by CellTiter-Glo assay of HCC827 cells treated with serial dilutions of erlotinib for 72 hr. Error bars represent mean ± standard deviation (SD); n = 4. (B) Kinetic cell proliferation assay monitored by IncuCyte for HCC827 cells cultured in the presence of DMSO control or 1 µM erlotinib over a 30 day period. (C) Crystal violet staining colony formation assay of HCC827 cells treated with DMSO or 1 µM erlotinib for the indicated days. (D) Schematic outline of the genome-wide CRISPR-Cas9 screening workflow in HCC827 cells. (E) Scatterplot depicting gene level results for erlotinib negatively selected hits in the CRISPR screen. A number of representative hits are shown in color. (F) Scatterplot depicting gene level results for erlotinib positively selected hits in the CRISPR screen. A number of representative hits are shown in color. (G) STRING protein network of the 35 negatively selected hits as defined in (E). The nodes represent indicated proteins, and colored nodes highlight proteins enriched in certain signaling pathways. The edges represent protein-protein associations, and the line thickness indicates the strength of data support. The minimum required interaction score was set to default medium confidence (0.4), and the disconnected nodes were removed from the network. (H) STRING protein network of the 47 positively selected hits as defined in (F).


