. 2019 Nov 19;8:e50223. doi: 10.7554/eLife.50223

Figure 2. Validation of selected hits by individual knockout in HCC827 cells.

(A) Immunoblots of indicated proteins in cells treated with DMSO or erlotinib (1 µM) for 6 hr to confirm specific knockout of negatively selected hits and on-target inhibition of EGFR pathway by erlotinib treatment. β-Actin was used as a loading control. Individual knockout cell lines were generated by lentivirus-mediated expression of sgRNA targeting indicated genes in HCC827 cells with constitutive Cas9 expression. (B) Crystal violet staining colony formation assay of indicated HCC827 cell lines treated with DMSO, erlotinib (1 µM), or gefitinib (1 µM). (C) Quantification of colony formation in (B), shown as percentage of the sgAAVS sample. Mean (three biological replicates) ± standard deviation (SD) is shown. (D) Immunoblots of indicated proteins in cells treated with DMSO or erlotinib (1 µM) for 6 hr to confirm specific knockout of positively selected hits and on-target inhibition of EGFR pathway by erlotinib treatment. β-Actin was used as a loading control. (E) Crystal violet staining colony formation assay of indicated HCC827 cell lines treated with DMSO, erlotinib (1 µM), or gefitinib (1 µM). (F) Quantification of colony formation in (E), shown as percentage of the sgAAVS sample. Mean (three biological replicates) ± SD is shown. Statistical significance was tested using unpaired two-tailed t test (C and F); *p<0.05, **p<0.01, ***p<0.001, ****p<0.0001; ns, not significant.

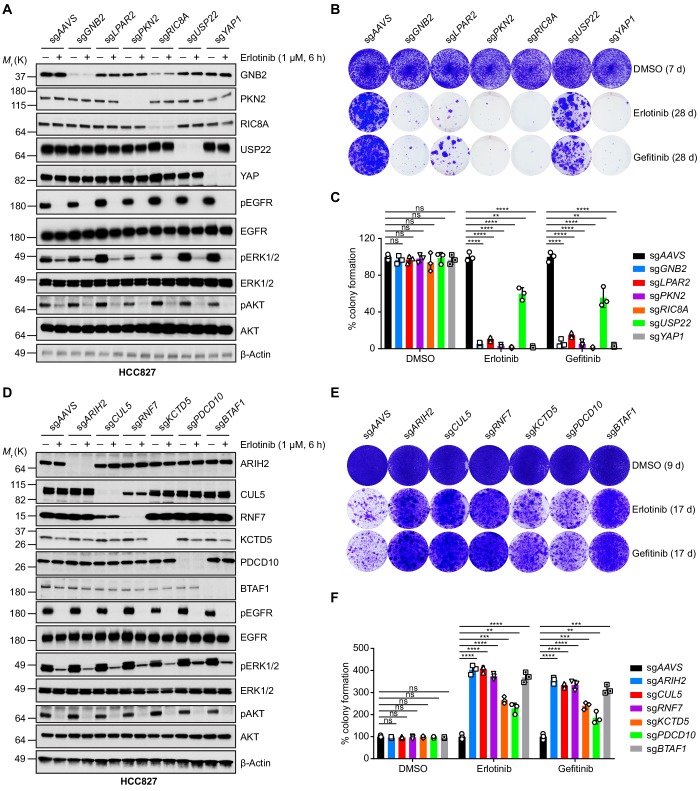
Figure 2—source data 1. Raw data from Figure 2.

Figure 2.

Figure 2—figure supplement 1. Validation of selected hits by individual knockout in NCI-H3255 cells.

Figure 2—figure supplement 1.

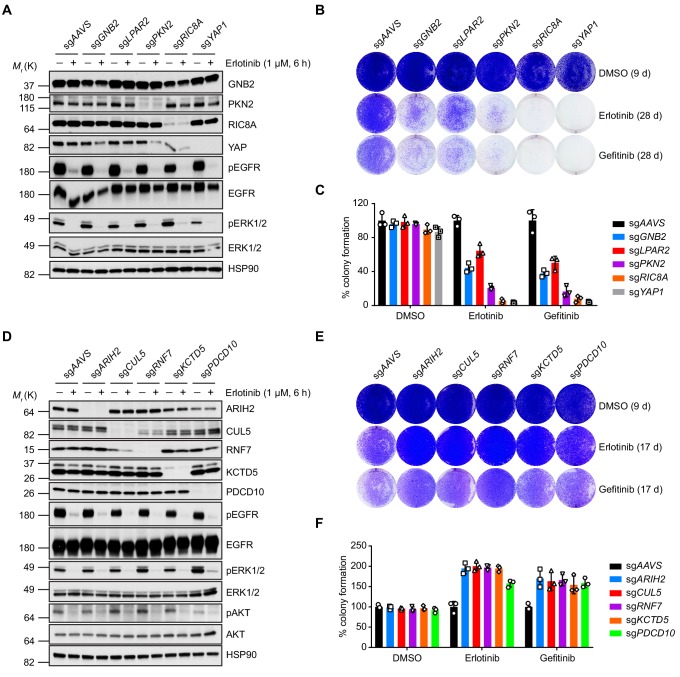
(A) Immunoblots of indicated proteins in cells treated with DMSO or erlotinib (1 µM) for 6 hr to confirm specific knockout of negatively selected hits and erlotinib efficacy. HSP90 was used as a loading control. Individual knockout cell lines were generated by lentivirus-mediated expression of sgRNA targeting indicated genes in NCI-H3255 cells with constitutive Cas9 expression. (B) Crystal violet staining colony formation assay of indicated NCI-H3255 cell lines treated with DMSO, erlotinib (1 µM), or gefitinib (1 µM). (C) Quantification of colony formation in (B), shown as percentage of the sgAAVS sample. Mean (three biological replicates) ± standard deviation (SD) is shown. (D) Immunoblots of indicated proteins in cells treated with DMSO or erlotinib (1 µM) for 6 hr to confirm specific knockout of positively selected hits and erlotinib efficacy. HSP90 was used as a loading control. (E) Crystal violet staining colony formation assay of indicated NCI-H3255 cell lines treated with DMSO, erlotinib (1 µM), or gefitinib (1 µM). (F) Quantification of colony formation in (E), shown as percentage of the sgAAVS sample. Mean (three biological replicates) ± SD is shown.
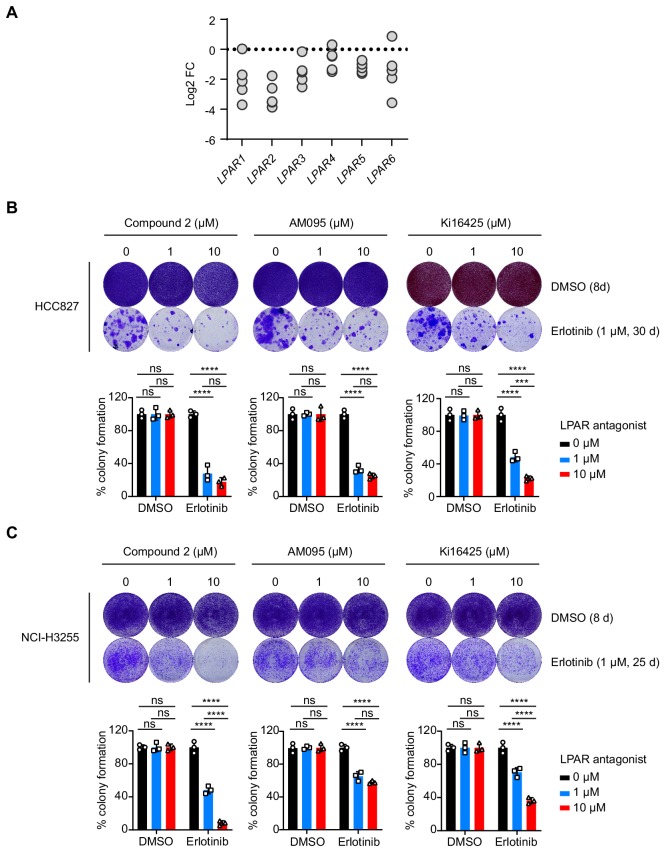
Figure 2—figure supplement 2. Targeting LPARs sensitizes EGFR-mutant NSCLC cells to EGFR inhibition.

Figure 2—figure supplement 2.

(A) Dot plot showing the distribution of individual sgRNAs targeting all six members of the LPAR family in the CRISPR screen. Data are presented as log2 fold change of each sgRNA sequence based on the abundance in the erlotinib-treated versus DMSO-treated cell population. (B) Crystal violet staining colony formation assay of HCC827 cells treated with indicated compounds (upper panel). Bottom: quantification of colony formation in the upper panel. Error bars represent mean ± SD; n = 3. (C) Crystal violet staining colony formation assay of NCI-H3255 cell treated with indicated compounds (upper panel). Bottom: quantification of colony formation in the upper panel. Error bars represent mean ± SD; n = 3.