. 2019 Nov 19;8:e50223. doi: 10.7554/eLife.50223

Figure 3. RIC8A depletion causes synthetic lethality with EGFR-TKI in EGFR-mutant NSCLC.

(A) Immunoblots of indicated proteins in control (sgAAVS) or RIC8A knockout (sgRIC8A) HCC827 cells treated with DMSO or erlotinib (1 µM) for 6 hr to confirm specific knockout of RIC8A and on-target inhibition of EGFR pathway by erlotinib treatment. Tubulin was used as a loading control. (B) Cell viability assessment by CellTiter-Glo assay of HCC827 cells treated with serial dilutions of erlotinib for 72 hr. Error bars represent mean ± standard deviation (SD); n = 4. (C) Activated caspase 3/7 measurement of HCC827 cells treated with serial dilutions of erlotinib for 24 hr. Error bars represent mean ± SD; n = 4. (D) Crystal violet staining colony formation assay of indicated HCC827 cell lines treated with DMSO, erlotinib (1 µM), or gefitinib (1 µM). (E) Quantification of colony formation in (D), shown as percentage of the sgAAVS sample. Mean (three biological replicates) ± SD is shown. (F) Immunoblots of indicated proteins in control or RIC8A knockout NCI-H3255 cells treated with DMSO or erlotinib (1 µM) for 6 hr to confirm specific knockout of RIC8A and on-target inhibition of EGFR pathway by erlotinib treatment. Tubulin was used as a loading control. (G) Cell viability assessment by CellTiter-Glo assay of NCI-H3255 cells treated with serial dilutions of erlotinib for 72 hr. Error bars represent mean ± SD; n = 4. (H) Activated caspase 3/7 measurement of NCI-H3255 cells treated with serial dilutions of erlotinib for 24 hr. Error bars represent mean ± SD; n = 4. (I) Crystal violet staining colony formation assay of indicated NCI-H3255 cell lines treated with DMSO, erlotinib (1 µM), or gefitinib (1 µM). (J) Quantification of colony formation in (I), shown as percentage of the sgAAVS sample. Mean (three biological replicates)± SD is shown. (K) Immunoblots of indicated proteins in control or RIC8A knockout NCI-H1975 cells treated with DMSO or EGF816 (1 µM) for 6 hr to confirm specific knockout of RIC8A and on-target inhibition of EGFR pathway by EGF816 treatment. Tubulin was used as a loading control. (L) Cell viability assessment by CellTiter-Glo assay of NCI-H1975 cells treated with serial dilutions of EGF816 for 72 hr. Error bars represent mean ± SD; n = 4. (M) Activated caspase 3/7 measurement of NCI-H1975 cells treated with serial dilutions of EGF816 for 24 hr. Error bars represent mean ± SD; n = 4. (N) Crystal violet staining colony formation assay of indicated NCI-H1975 cell lines treated with DMSO or EGF816 (1 µM). (O) Quantification of colony formation in (N), shown as percentage of the sgAAVS sample. Mean (three biological replicates) ± SD is shown. Statistical significance was tested using unpaired two-tailed t test (E, J and O); *p<0.05, **p<0.01, ***p<0.001, ****p<0.0001; ns, not significant.

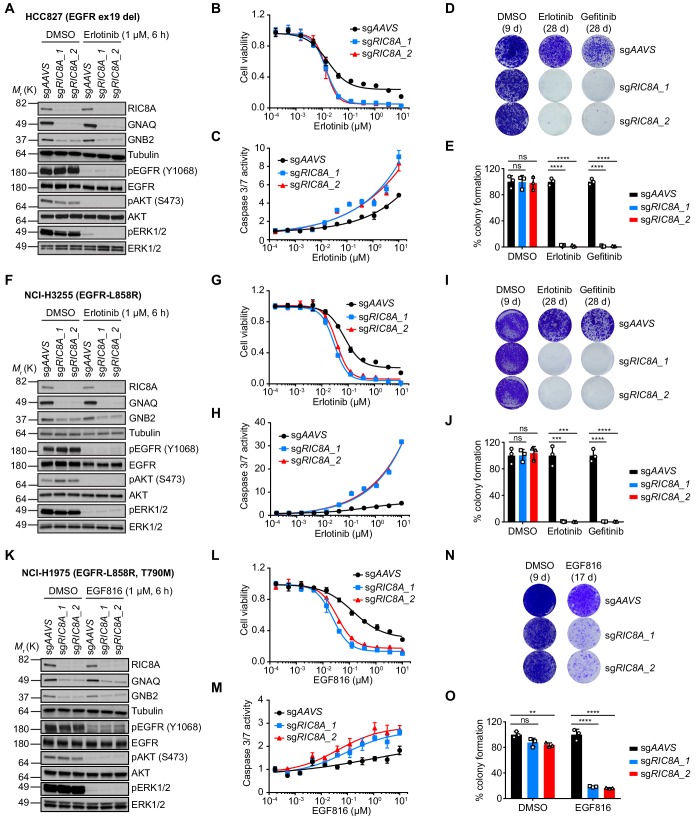
Figure 3—source data 1. Raw data from Figure 3.

Figure 3.

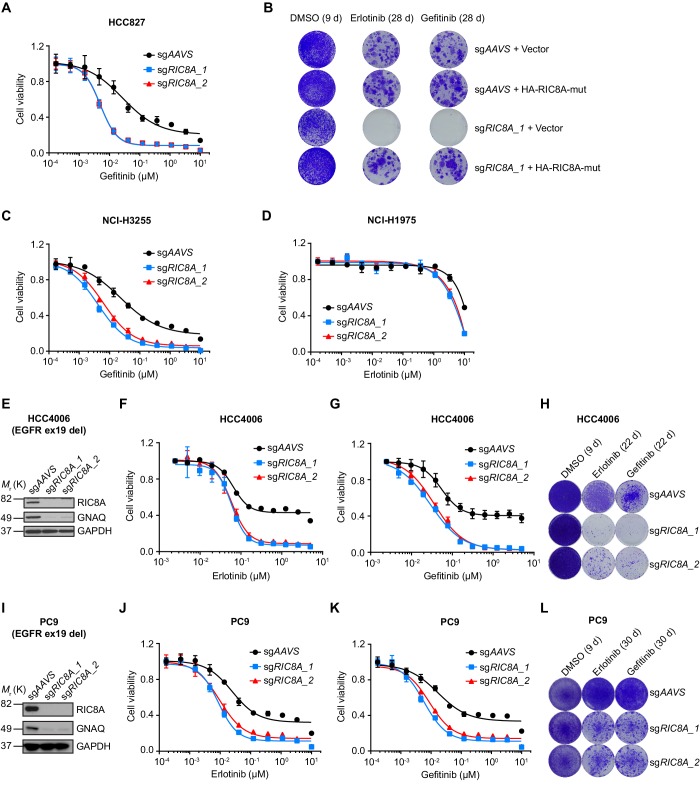
Figure 3—figure supplement 1. RIC8A loss is synthetic lethal with EGFR-TKI in EGFR-mutant NSCLC.

Figure 3—figure supplement 1.

(A) Cell viability assessment by CellTiter-Glo assay of control or RIC8A knockout HCC827 cells treated with serial dilutions of gefitinib for 72 hr. Error bars represent mean ± SD; n = 4. (B) Crystal violet staining colony formation assay showing the rescued phenotype by overexpression of CRISPR/Cas9-resistant RIC8A. (C) Cell viability assessment by CellTiter-Glo assay of control or RIC8A knockout NCI-H3255 cells treated with serial dilutions of gefitinib for 72 hr. Error bars represent mean ± SD; n = 4. (D) Cell viability assessment by CellTiter-Glo assay of control or RIC8A knockout NCI-H1975 cells treated with serial dilutions of erlotinib for 72 hr. Error bars represent mean ± SD; n = 4. (E) Immunoblots of RIC8A and GNAQ confirm the RIC8A knockout efficiency and functional outcome of RIC8A knockout in HCC4006 cells. GAPDH was used as a loading control. (F) Cell viability assessment by CellTiter-Glo assay of control or RIC8A knockout HCC4006 cells treated with serial dilutions of erlotinib for 72 hr. Error bars represent mean ± SD; n = 4. (G) Cell viability assessment by CellTiter-Glo assay of control or RIC8A knockout HCC4006 cells treated with serial dilutions of gefitnib for 72 hr. Error bars represent mean ± SD; n = 4. (H) Crystal violet staining colony formation assay of control or RIC8A knockout HCC4006 cells treated with DMSO, erlotinib (1 µM), or gefitinib (1 µM). (I) Immunoblots of RIC8A and GNAQ confirm the RIC8A knockout efficiency and functional outcome of RIC8A knockout in PC9 cells. GAPDH was used as a loading control. (J) Cell viability assessment by CellTiter-Glo assay of control or RIC8A knockout PC9 cells treated with serial dilutions of erlotinib for 72 hr. Error bars represent mean ± SD; n = 4. (K) Cell viability assessment by CellTiter-Glo assay of control or RIC8A knockout PC9 cells treated with serial dilutions of gefitnib for 72 hr. Error bars represent mean ± SD; n = 4. (L) Crystal violet staining colony formation assay of control or RIC8A knockout PC9 cells treated with DMSO, erlotinib (1 µM), or gefitinib (1 µM).
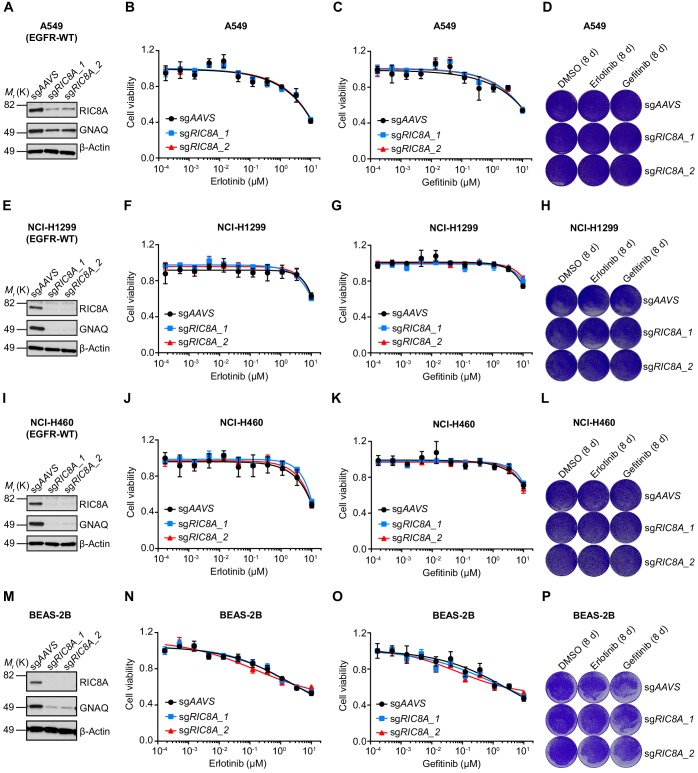
Figure 3—figure supplement 2. RIC8A loss exhibits no effect on EGFR TKI sensitivity in EGFR-WT NSCLC cells or normal human bronchial epithelial cells.

Figure 3—figure supplement 2.

(A) Immunoblots of RIC8A and GNAQ confirm the RIC8A knockout efficiency and functional outcome of RIC8A knockout in A549 cells. β-Actin was used as a loading control. (B) Cell viability assessment by CellTiter-Glo assay of control or RIC8A knockout A549 cells treated with serial dilutions of erlotinib for 72 hr. Error bars represent mean ± SD; n = 4. (C) Cell viability assessment by CellTiter-Glo assay of control or RIC8A knockout A549 cells treated with serial dilutions of gefitinib for 72 hr. Error bars represent mean ± SD; n = 4. (D) Crystal violet staining colony formation assay of control or RIC8A knockout A549 cells treated with DMSO, erlotinib (1 µM), or gefitinib (1 µM). (E) Immunoblots of RIC8A and GNAQ confirm the RIC8A knockout efficiency and functional outcome of RIC8A knockout in NCI-1299 cells. β-Actin was used as a loading control. (F) Cell viability assessment by CellTiter-Glo assay of control or RIC8A knockout NCI-H1299 cells treated with serial dilutions of erlotinib for 72 hr. Error bars represent mean ± SD; n = 4. (G) Cell viability assessment by CellTiter-Glo assay of control or RIC8A knockout NCI-H1299 cells treated with serial dilutions of gefitinib for 72 hr. Error bars represent mean ± SD; n = 4. (H) Crystal violet staining colony formation assay of control or RIC8A knockout NCI-H1299 cells treated with DMSO, erlotinib (1 µM), or gefitinib (1 µM). (I) Immunoblots of RIC8A and GNAQ confirm the RIC8A knockout efficiency and functional outcome of RIC8A knockout in NCI-H460 cells. β-Actin was used as a loading control. (J) Cell viability assessment by CellTiter-Glo assay of control or RIC8A knockout NCI-H460 cells treated with serial dilutions of erlotinib for 72 hr. Error bars represent mean ± SD; n = 4. (K) Cell viability assessment by CellTiter-Glo assay of control or RIC8A knockout NCI-H460 cells treated with serial dilutions of gefitinib for 72 hr. Error bars represent mean ± SD; n = 4. (L) Crystal violet staining colony formation assay of control or RIC8A knockout NCI-H460 cells treated with DMSO, erlotinib (1 µM), or gefitinib (1 µM). (M) Immunoblots of RIC8A and GNAQ confirm the RIC8A knockout efficiency and functional outcome of RIC8A knockout in BEAS-2B cells. β-Actin was used as a loading control. (N) Cell viability assessment by CellTiter-Glo assay of control or RIC8A knockout BEAS-2B cells treated with serial dilutions of erlotinib for 72 hr. Error bars represent mean ± SD; n = 4. (O) Cell viability assessment by CellTiter-Glo assay of control or RIC8A knockout BEAS-2B cells treated with serial dilutions of gefitinib for 72 hr. Error bars represent mean ± SD; n = 4. (P) Crystal violet staining colony formation assay of control or RIC8A knockout BEAS-2B cells treated with DMSO, erlotinib (1 µM), or gefitinib (1 µM).