. 2019 Nov 19;8:e50223. doi: 10.7554/eLife.50223

Figure 4. RIC8A loss attenuates YAP signaling to synergize with EGFR-TKI in EGFR-mutant NSCLC.

(A) Immunoblots of indicated proteins in HEK293A cells upon knockout of indicated genes. GAPDH was used as a loading control. (B) RIC8A knockout decreases the YAP reporter activity in HEK293A cells, assessed by flow cytometry analysis of GFP. (C) Quantitative RT-PCR analysis of relative mRNA levels of YAP target genes in control or RIC8A knockout HEK293A cells. Error bars represent mean ± SD; n = 4. (D) Immunoblots of pYAP (S127) and YAP/TAZ in indicated EGFR-mutant NSCLC cell lines treated with DMSO or 1 µM EGFR-TKI (Erlotinib, except EGF816 for NCI-H1975) for 24 hr. Tubulin was used as a loading control. (E) Quantitative RT-PCR analysis of relative mRNA levels of YAP target genes in control or RIC8A knockout EGFR-mutant NSCLC cell lines. Error bars represent mean ± SD; n = 4. (F) Immunoblots of RIC8A and YAP/TAZ in indicated HCC827 cells to confirm RIC8A knockout and YAP-5SA overexpression. GAPDH was used as loading control. (G) Quantitative RT-PCR analysis of relative mRNA levels of YAP target genes in control or RIC8A knockout HCC827 cells with ectopic expression of constitutively active YAP (YAP-5SA). Error bars represent mean ± SD; n = 4. (H) Cell viability assessment by CellTiter-Glo assay of indicated HCC827 cell lines treated with serial dilutions of erlotinib for 72 hr. Error bars represent mean ± SD; n = 4. (I) Crystal violet staining colony formation assay of indicated HCC827 cell lines treated with DMSO, erlotinib (1 µM), or gefitinib (1 µM). (J) Quantification of colony formation in (I), shown as percentage of the Vector-sgAAVS sample. Error bars represent mean ± SD; n = 3. Statistical significance was tested using unpaired two-tailed t test (C and E) or ordinary two-way ANOVA (J); *p<0.05, **p<0.01, ***p<0.001, ****p<0.0001; ns, not significant.

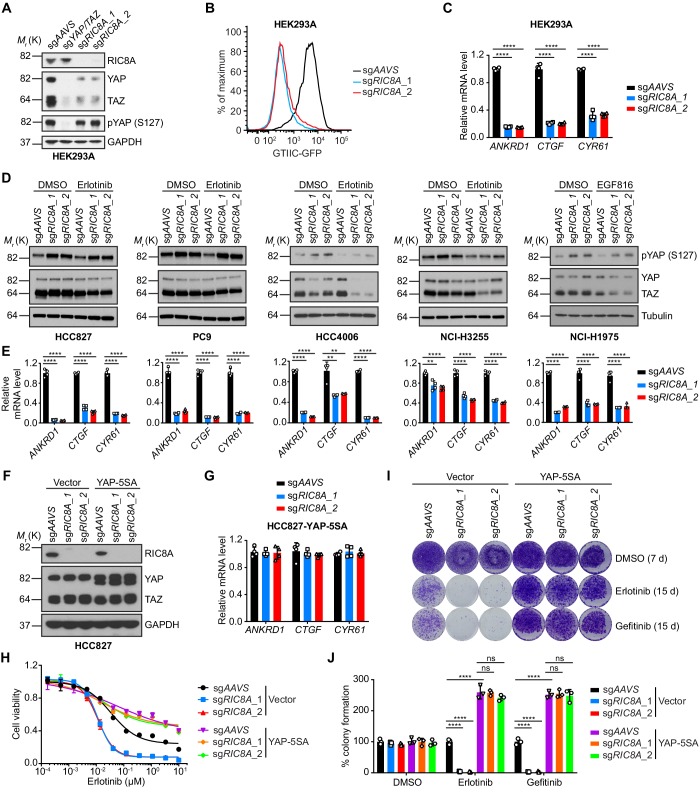
Figure 4—source data 1. Raw data from Figure 4.

Figure 4.

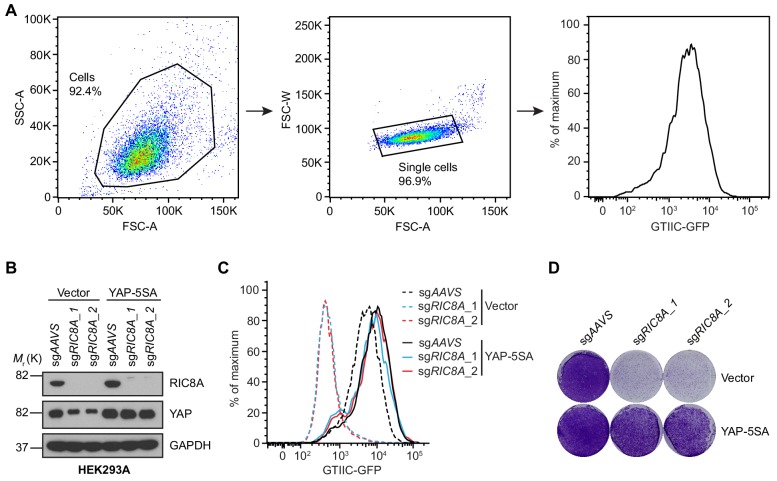
Figure 4—figure supplement 1. Overexpression of constitutively active YAP (YAP-5SA) blocks RIC8A loss induced reduction in YAP signaling and growth defect in HEK293A cells.

Figure 4—figure supplement 1.

(A) Representative flow cytometry gating strategy to analyze GTIIC-GFP YAP reporter activity in HEK293A cells. Cells were gated using FSC-A/SSC-A characteristics, singlets were gated using FSC-A/FSC-W characteristics, and GFP signal was plotted as a histogram. (B) Immunoblots of RIC8A and YAP in indicated HEK293A cells to confirm RIC8A knockout and YAP-5SA overexpression. GAPDH was used as loading control. (C) Histogram showing that RIC8A knockout decreases the YAP reporter activity in HEK293A cells, which can be rescued by ectopic expression of YAP-5SA, assessed by flow cytometry analysis of GFP. (D) Crystal violet staining colony formation assay of the indicated HEK293A cell lines showing that RIC8A knockout reduces HEK293A cell growth, which can be rescued by ectopic expression of YAP-5SA.
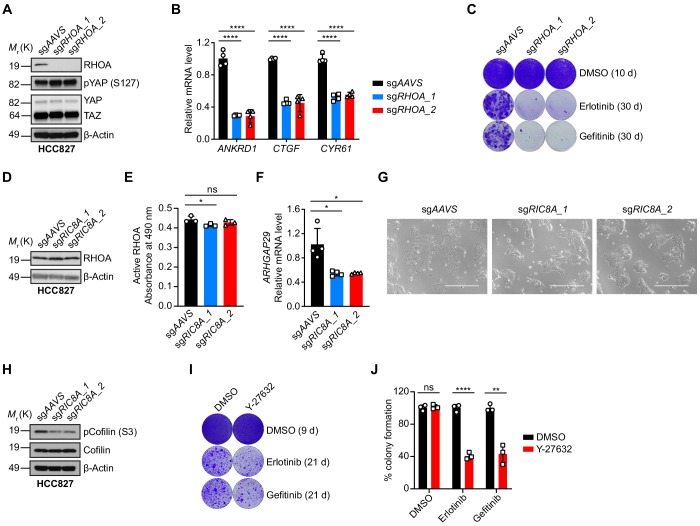
Figure 4—figure supplement 2. RHOA signaling is involved in RIC8A-mediated regulation of EGFR TKI sensitivity.

Figure 4—figure supplement 2.

(A) Immunoblots of indicated proteins in control or RHOA knockout HCC827 cells. β-Actin was used as a loading control. (B) Quantitative RT-PCR analysis of relative mRNA levels of YAP target genes in control or RHOA knockout HCC827 cells. Error bars represent mean ± SD; n = 4. (C) Crystal violet staining colony formation assay showing the synthetic lethality of RHOA knockout with EGFR inhibition in HCC827 cells. (D) Immunoblot of RHOA in control or RIC8A knockout HCC827 cells. β-Actin was used as a loading control. (E) RHOA G-LISA activation assay to detect the active RHOA signal from control or RIC8A knockout HCC827 cells. Error bars represent mean ± SD; n = 3. (F) Quantitative RT-PCR analysis of relative ARHGAP29 mRNA level in control or RIC8A knockout HCC827 cells. Error bars represent mean ± SD; n = 4. (G) Photomicrographs of control or RIC8A knockout HCC827 cells showing the morphological change upon RIC8A knockout. (H) Immunoblots of indicated proteins in control or RIC8A knockout HCC827 cells. β-Actin was used as a loading control. (I) Crystal violet staining colony formation assay showing the synthetic lethality of Y-27632 treatment with EGFR inhibition in HCC827 cells. (J) Quantification of colony formation in (I), shown as percentage of the DMSO sample. Error bars represent mean ± SD; n = 3. Statistical significance was tested using unpaired two-tailed t test (B, E, F and J); *p<0.05, **p<0.01, ***p<0.001, ****p<0.0001; ns, not significant.