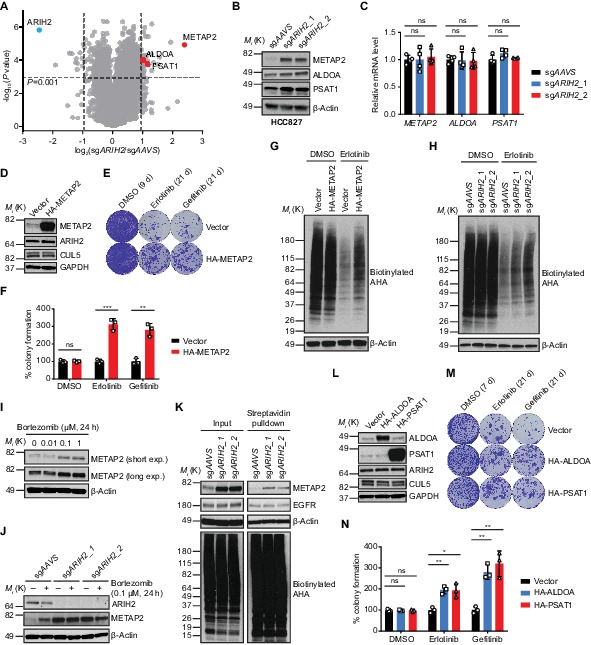
Figure 6. Mechanistic insights into ARIH2 loss-mediated EGFR-TKI resistance.
(A) Mass spectrometry analysis of global protein changes between control and ARIH2-deficient HCC827 cells. (B) Immunoblots of indicated proteins in control and ARIH2-deficient HCC827 cells. β-Actin was used as a loading control. (C) Quantitative RT-PCR analysis of relative mRNA levels of indicated genes in control or ARIH2-deficient HCC827 cells. Error bars represent mean ± SD; n = 4. (D) Immunoblots of indicated proteins showing ectopic expression of HA-METAP2 in HCC827 cells. GAPDH was used as a loading control. (E) Crystal violet staining colony formation assay of HCC827-Vector or HCC827-HA-METAP2 cell lines treated with DMSO, erlotinib (1 µM), or gefitinib (1 µM). (F) Quantification of colony formation in (E), shown as percentage of the HCC827-Vector sample. Mean (three biological replicates) ± SD is shown. (G) De novo protein synthesis of HCC827-Vector or HCC827-HA-METAP2 cells after treatment with DMSO or erlotinib (1 µM, 24 hr) as determined by L-azidohomoalanine (AHA) labeling. Cells were starved of methionine for 1 hr and incubated with AHA for 1 hr. Lysates were subjected to a Click-iT chemistry reaction to switch azido-modified nascent proteins to alkyne-biotin, and visualized by Streptavidin-HRP immunoblotting. β-Actin was used as a loading control. (H) De novo protein synthesis of control or ARIH2-deficient HCC827 cells after treatment with DMSO or erlotinib (1 µM, 24 hr) as determined by AHA labeling. β-Actin was used as a loading control. (I) Immunoblot of METAP2 in HCC827 cells upon proteasome inhibitor bortezomib treatment. β-Actin was used as a loading control. (J) Immunoblots of ARIH2 and METAP2 in control or ARIH2 knockout HCC827 cells upon bortezomib treatment. β-Actin was used as a loading control. (K) De novo METAP2 protein synthesis in control or ARIH2-deficient HCC827 cells as determined by AHA labeling and streptavidin pulldown. β-Actin was used as a loading control. (L) Immunoblots of indicated proteins showing ectopic expression of HA-ALDOA and HA-PSAT1 in HCC827 cells. GAPDH was used as a loading control. (M) Crystal violet staining colony formation assay of HCC827-Vector, HCC827-HA-ALDOA or HCC827-HA-PSAT1 cells treated with DMSO, erlotinib (1 µM), or gefitinib (1 µM). (N) Quantification of colony formation in (M), shown as percentage of the HCC827-Vector sample. Mean (three biological replicates) ± SD is shown. Statistical significance was tested using unpaired two-tailed t test (C, F and N); *p<0.05, **p<0.01, ***p<0.001, ****p<0.0001; ns, not significant.


