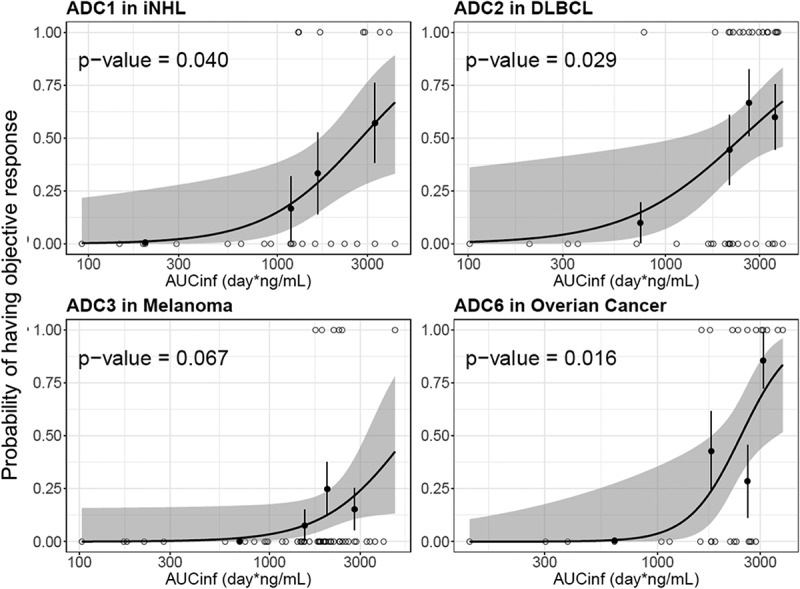
Figure 6.

Logistic regression analysis of exposure-efficacy (ORR) response relationship by acMMAE AUCinf at Cycle 1.
The black line and shaded gray area represent logistic regression model prediction and 90% confidence interval of predictions, open circle show exposure of individual patients with event (p = 1) and without events (p = 0), black solid circle and vertical lines show observed fraction of subjects with events in each exposure quartile and 90% confidence interval for these fractions. acMMAE: antibody-conjugated MMAE, AUCinf: area under the concentration–time curve from time zero to infinity, ADC1 = Pinatuzumab vedotin (CD22); ADC2 = Polatuzumab vedotin (CD79b); ADC3 = DEDN6526A (ETBR); ADC6 = DNIB0600A (Napi2b); iNHL = indolent non-Hodgkin’s Lymphomas; DLBCL = diffuse large B-cell lymphoma.
