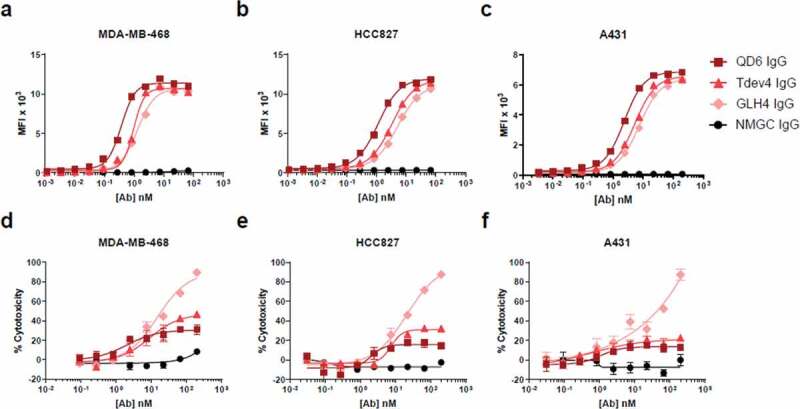
Figure 1.

Cell binding and CDC activity of anti-EGFR IgG variants. (a–c) Cell binding of anti-EGFR IgG variants to EGFR-expressing cell lines MDA-MB-468 (a), HCC827 (b), and A431 (c) cells. (d–f) CDC activity of anti-EGFR IgG variants against MDA-MB-468 (d), HCC827 (e), and A431 (f) cells, using rabbit complement at a final concentration of 10% (vol/vol). In (d-f), % of cell lysis was determined 4 hrs after addition of cells, antibodies and serum. Antibody-specific complement dependent cytotoxicity was calculated using the formula: % cytotoxicity = 100 x (1 – E/S), where E is the luminescence with experimental antibody, and S is the luminescence without antibody, but with the same concentration of serum. NMGC was used as an isotype control. Each point represents the mean values of triplicate wells, and the standard error of the mean is represented by error bars. See Table 2 for statistical analysis and P values.
