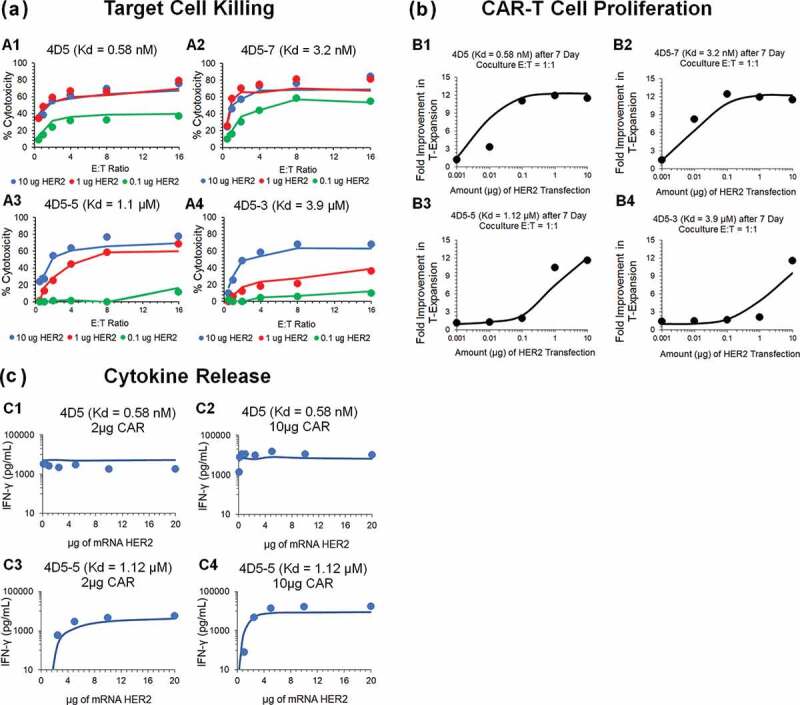
Figure 3.

Observed and model fitted profiles for affinity variant anti-HER2 CAR-T cells activity in an in-vitro system. (A) Target cell killing: Observed (in dots) and model-generated (solid lines) profiles of % cytotoxicity (at 8h) of NALM-6-CBG cells transiently transfected with 0.1 (green), 1 (red) and 10 (blue) µg of HER2 mRNA respectively and cocultured with affinity variant anti-HER2 CAR-Ts, i.e., 4D5 (Kd = 0.58 nM, fig A1), 4D5-7 (Kd = 3.2 nM, fig A2), 4D5-5 (Kd = 1.1 µM, fig A3) and 4D5-3 (Kd = 3.9 µM, fig A4) respectively, as a function of varying E:T ratios. (B) CAR-T cell proliferation: Observed (in dots) and model-generated (solid lines) profiles of fold-expansion of affinity variant anti-HER2 CAR-T cells, i.e., 4D5 (Kd = 0.58 nM, fig B1), 4D5-7 (Kd = 3.2 nM, fig B2), 4D5-5 (Kd = 1.1 µM, fig B3) and 4D5-3 (Kd = 3.9 µM, fig B4) respectively, as a function of antigen densities on HER2 expressing K562 cells cocultured at E:T ratio of 1:1 for 7 d. (C) Cytokine release: Observed (in dots) and model-generated (solid lines) profiles of IFN-γ release (pg/mL) as a function of different HER2 densities on K562 cells, when cocultured with CAR-T cells at E:T ratios of 1:1 for 24h. Figures C1 and C2 describes the cytokine release for high-affinity 4D5 CAR-T (Kd = 0.58 nM) with lower (fig. C1) and higher (fig. C2) CAR densities, respectively. Figures C3 and C4 describes the cytokine release for low-affinity 4D5-5 CAR-T (Kd = 1.12 µM) with lower (fig. C3) and higher (fig. C4) CAR densities, respectively.
