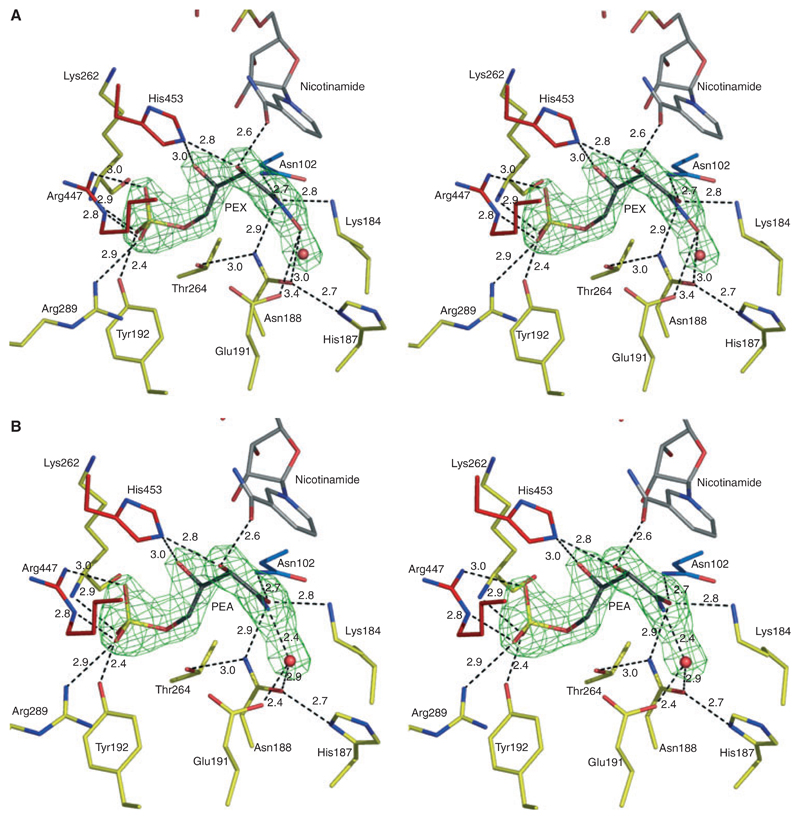
Fig. 6.
Stereoviews depicting inhibition of LlPDH. (A) Omit difference density map (green mesh) in the active site calculated as described in Fig. 5 by ignoring the scattering contributions from the ligands and the water (red sphere) in estimating αcalc, the map is contoured at 4σ. The PEX model is shown with C atoms in black. (B) PEA model.

