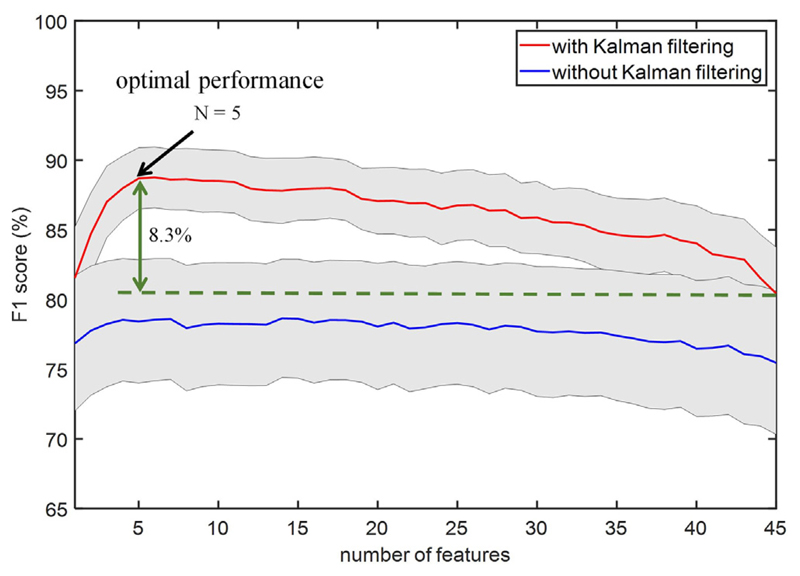
Fig. 10.
The grand-averaged classification performance with respect to number of features using the sequential feature selection method. The arrow shows the setting that leads to the highest performance on average, using the same XGB model for all patients. The gray area indicates the standard error across patients.

